MINERVA platform: User’s manual#
User view refers to the visualization and functionalities accessed by users of the content hosted by your MINERVA instance.
You can also see the summary of this page in the MINERVA >> Quick Reference Guide.
Main view#
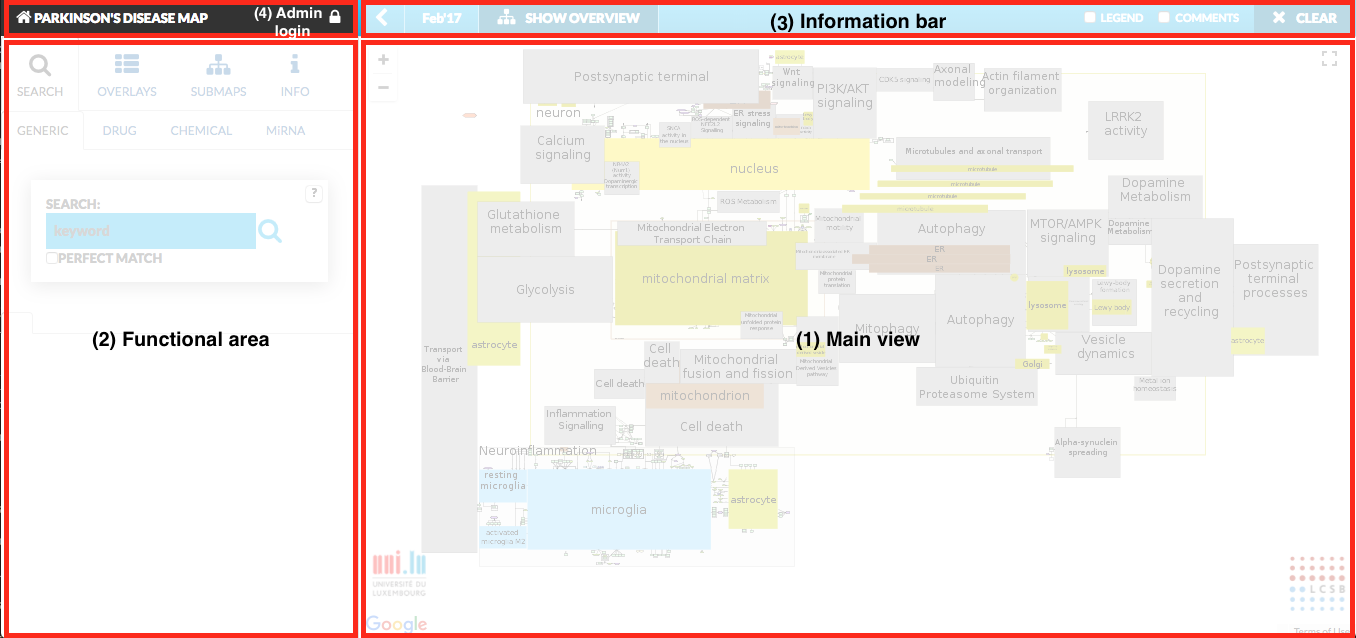
The main view of the MINERVA platform is summarized in the figure below.
 {:width=“800px”}
Main components of this view are
- Display area (1): where the contents of the projects are visualized
- Functional area (2): allowing for advanced interaction with explored content
- Information bar (3): containing additional overlay functions
- Admin login (4): allowing administrator login. To login as user go to Overlays or Info tab
Accessing the project#
Your instance of MINERVA platform can host many projects, which are uploaded via the administrator view
(see Admin manual - Add project). They are accessed by a provided, dedicated web address.
Exploring the display area#
The content is visualized using Google Maps API, and allows similar pan and zoom functionalities. The content is interactive, the user can click on an element or interaction to examine additional details displayed in the left panel (functional area).
The content is by default displayed in a semantic zoom mode, where compartments and areas in the submitted file cover underlying elements on higher levels of zoom. This view is generated procedurally, directly from the uploaded content. This view is generated automatically from the layout of the CellDesigner file. MINERVA platform calculates coverage of bigger areas by smaller, and assigns them to appropriate zoom levels. For more details see Section Content curation. You can turn off the semantic zoom view by going to the Overlays tab in the left panel (functional area), and changing the view to Network (see also Section Overlays tab).
Annotating, selecting and downloading the display area#
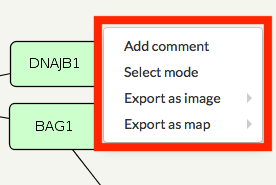
Right-click in the display area invokes a contextual menu with the following options - (see below).
 {:width=“400px”}
Add comment#
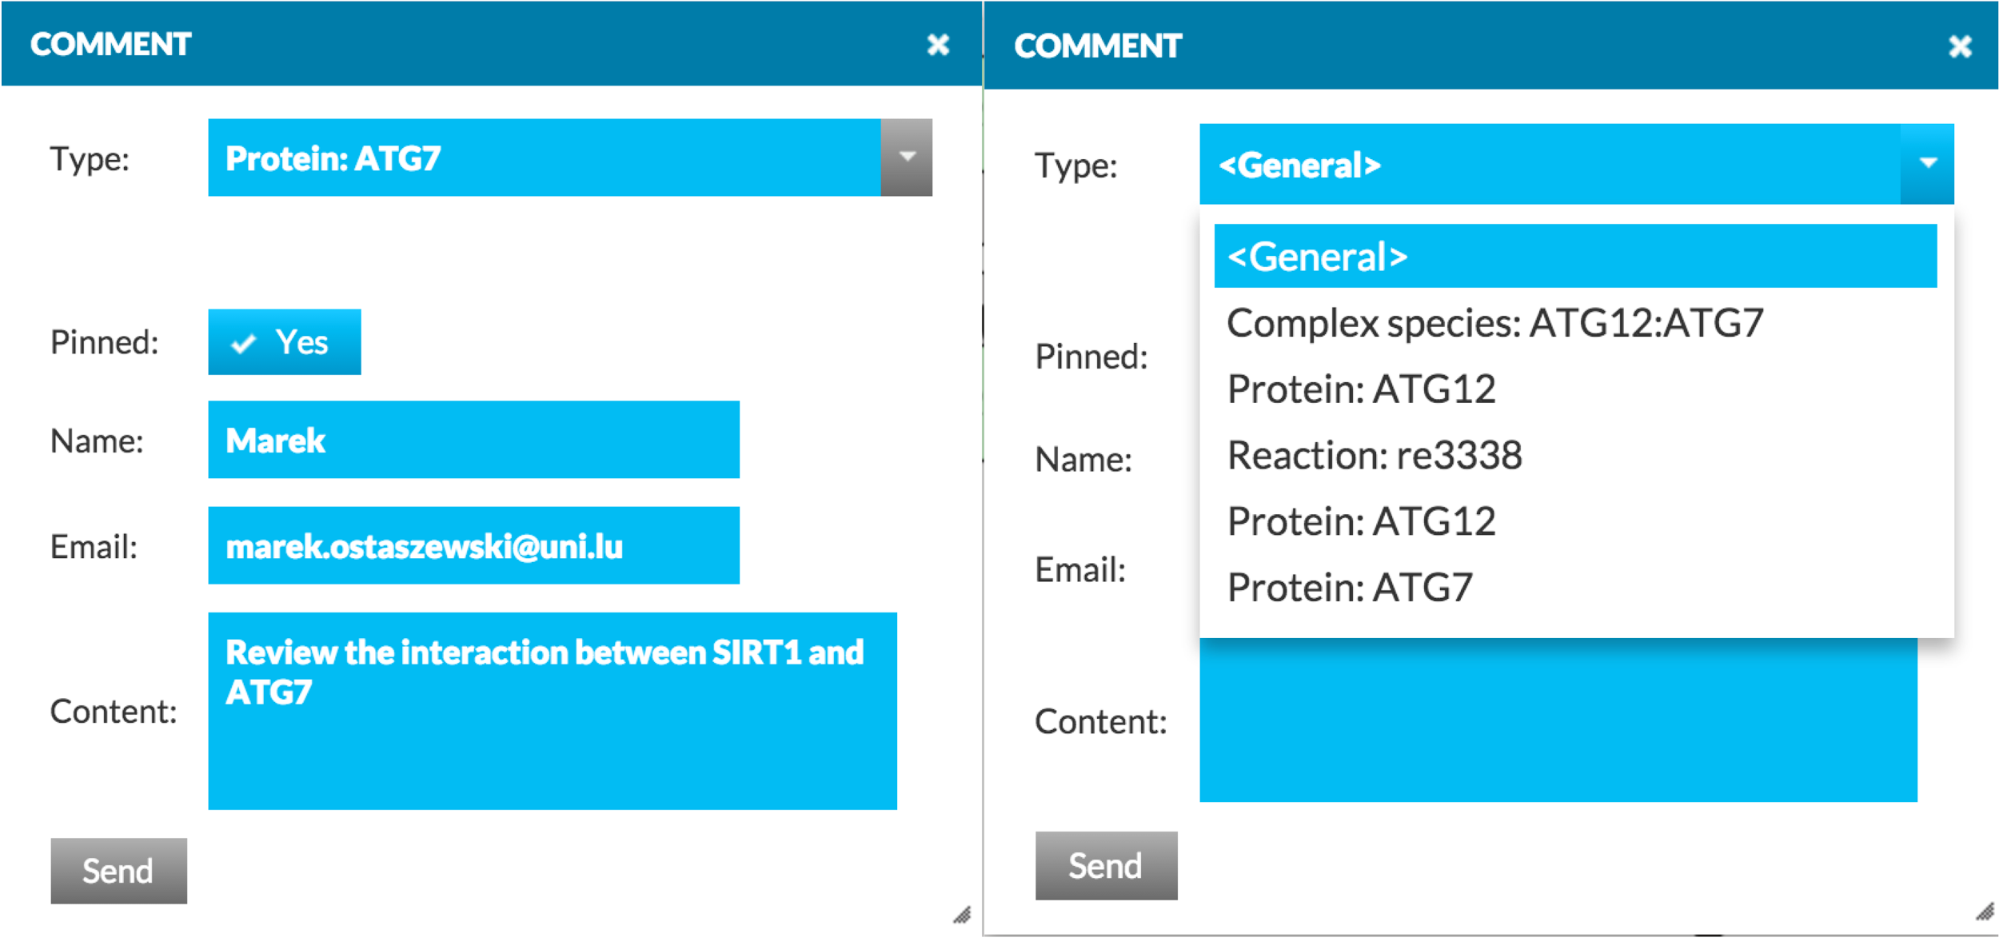
This functionality allows to annotate contents in the display area. Clicking the Add comment button invokes a form that can be filled out by the user and sent to the administrators of the project. The field Pinned controls, whether the comment will be visible in the map (see below, left).
 {:width=“800px”}
Type field is a drop-down menu, listing elements nearby to the click location. This allows to choose and attach the comment to a particular element or interaction (see above, right).
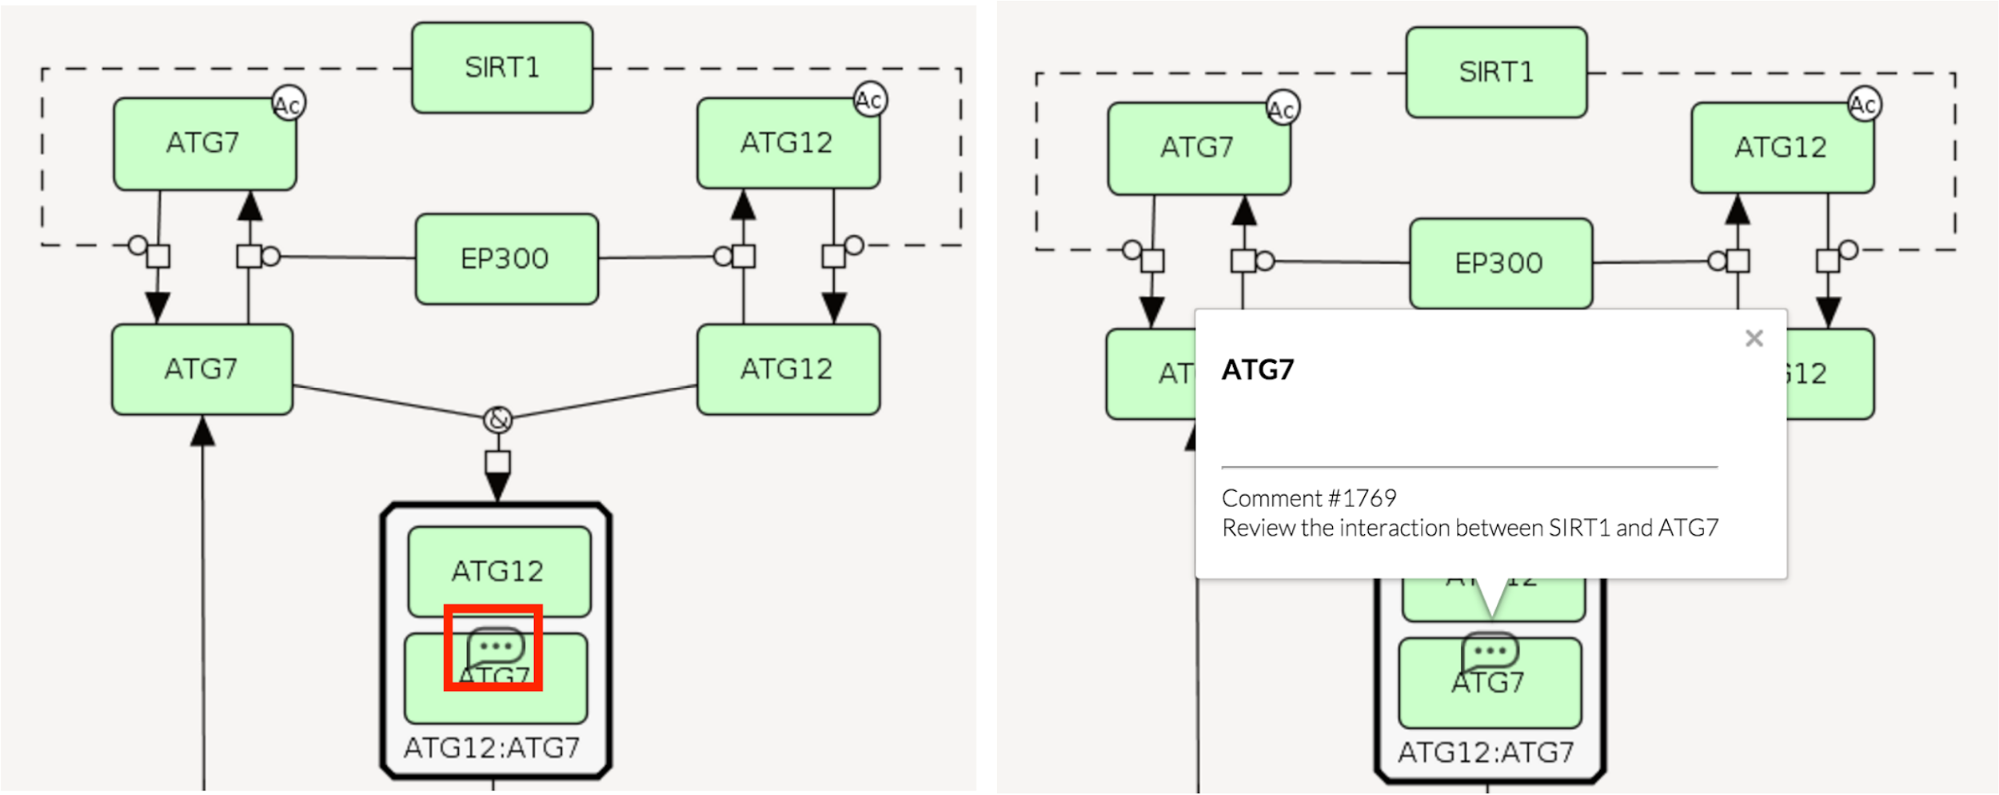
After sending, and if the field Pinned was set to Yes, the comment becomes visible in the display area, as shown below, to the left (after checking the Comments checkbox, see Comments).
 {:width=“800px”}
Clicking on the comment bubble displays annotated element and the text of the comment (see above, right). Name and email are not disclosed, they will be accessible only to project and platform administrators (see Admin manual - Comments).
Select mode#
Clicking the Select mode enables the functionality supported by Google Maps API, allowing to select an arbitrary shape in the display area. The shape then can be downloaded in various formats, either as a model (.xml file) or as an image (see below).
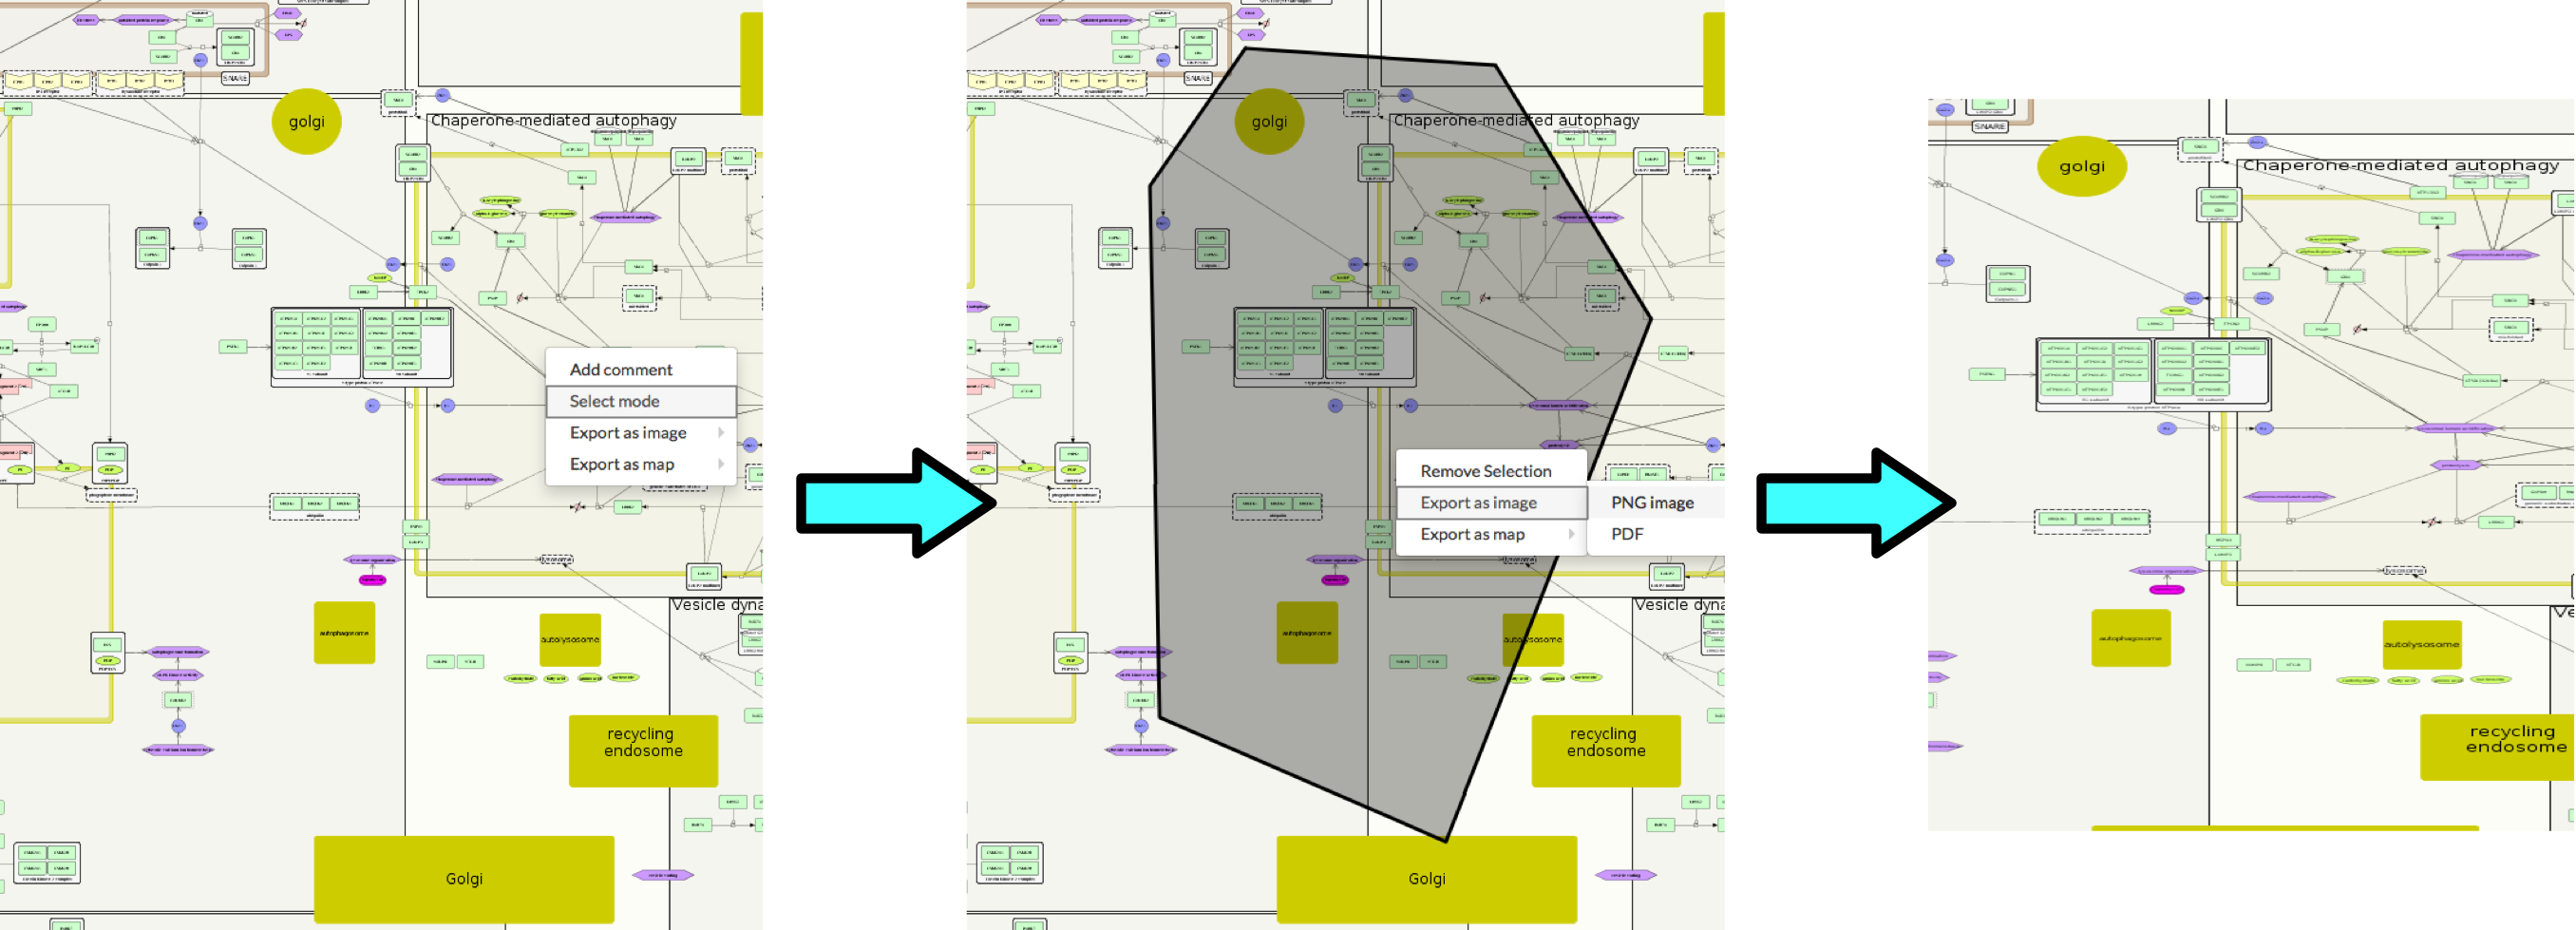 {:width=“800px”}
Export as image produces a rectangular image containing the selection. Export to vector graphics is supported, allowing to modify and enhance the downloaded image.
Export as map produces a file acceptable by either CellDesigner or pure SBGN editors, containing the editable fragment of the selected display area. Importantly, in the case of CellDesigner export, all additional annotations provided by MINERVA platform are downloaded as well.
Export as image#
This option creates an image of the part of map on your display area. Export to vector graphics is supported, allowing to modify and enhance the downloaded image.
Export as map#
This option allows to produces a file acceptable by either CellDesigner, or pure SBGN editors, containing the editable fragment of the selected display area. Importantly, in the case of CellDesigner export, all additional annotations provided by MINERVA platform are downloaded as well.
Content curation#
MINERVA framework handles SBGN-compliant format, produced either by CellDesigner (http://www.celldesigner.org/) or SBGN editors, like SBGN-ED (https://www.cls.uni-konstanz.de/software/vanted/add-ons/add-ons-current-vanted-version/). MINERVA relies on such externally curated content.
Moreover, a number of additional functionalities of MINERVA operates on metadata that can be provided in the SBGN-compliant file itself. These are the following:
- Processing of existing annotations: annotations to elements or interactions embedded within CellDesigner file (MIRIAM > Add relation) are automatically parsed and processed. They can be used to extensively annotate elements (see Admin manual - Configure automatic annotation) and they can be verified by MINERVA platform against a set of predefined content-governing rules (see Admin manual - Configure automatic verification).
- Procedural generation of semantic zoom : information on complexes and overlaying compartments is extracted from SBGN-compliant files to generate Pathways and compartments view, where on the high level of zoom bigger compartments overlay smaller ones, and on the middle levels of zoom contents of complexes are masked. Moreover, in CellDesigner, TextArea elements can be used to draw named rectangles covering functionally important areas. These will be incorporated into the generation of the semantic zoom as well. For this, you will need to create an additional area by
- clicking Edit > Add layer
- enabling Layer toolbox by checking View > Change toolbar visible > Layer
- drawing TextArea objects using a corresponding button
- Cross-platform SBGN translation: CellDesigner files can be uploaded to be displayed in pure SBGN notation (see Admin manual - Fields of the Add project window), and SBGN-displayed content can be downloaded as a pure SBGN file.
For explanation and examples on content curation and annotation, see Examples - CellDesigner file upload and annotation.
Functional area#
Functional area (the panel to the left from the display area) displays additional information about selected elements and interactions, allows to query the content, generate custom overlays and browse submaps.
Search tab#
Search tab allows to search for particular elements or interactions in the displayed map. Also, under this tab, the panel displays detailed information on selected elements or interactions (see below).
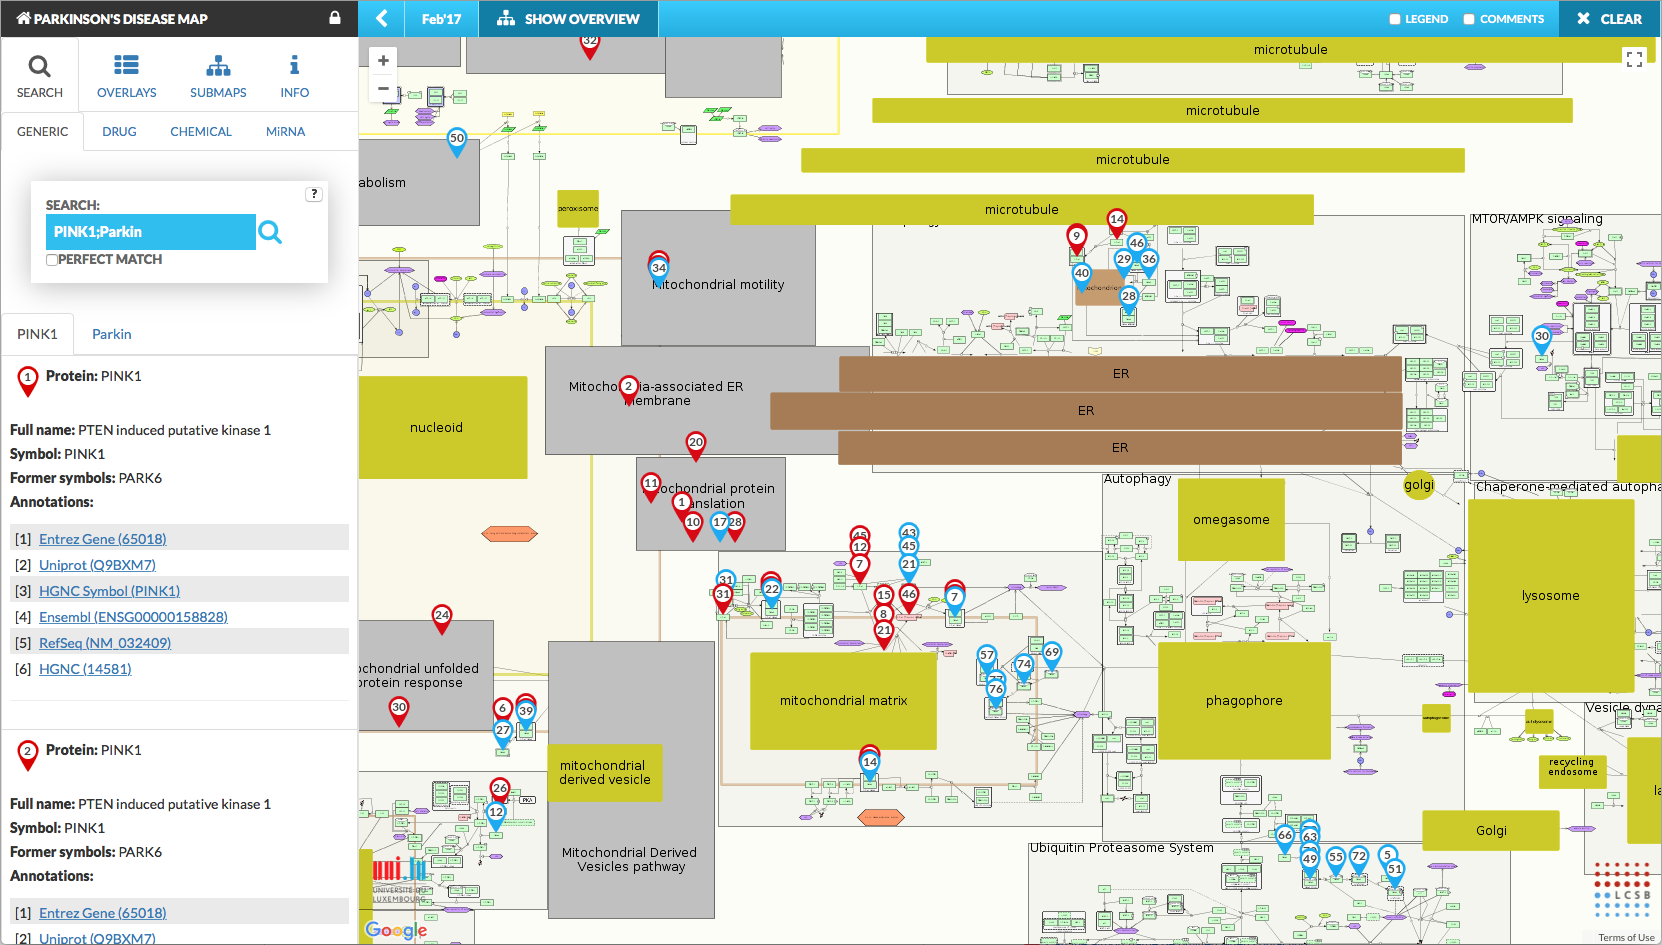 {:width=“800px”}
There are four subtabs available in the Search tab, offering different scopes:
- GENERIC for regular search
- DRUG for drug target search
- CHEMICAL for chemical target search
- MIRNA for miRNA target search
Generic#
The generic scope works as follows:
- Search field: Type your search query here, separating multiple elements with a semicolon ‘;’. Searches for separate terms will be visible in separate tabs. Search will look for similar names and synonyms of elements in the map. You can also search for an identifier of an interaction. (It is described by a number, to be found on the left panel after choosing a particular reaction you are interested in.) To do this, you need to add reaction: prefix to the searched identifier, e.g. for a reaction with and id “b9d64” you will search for a term “reaction:b9d64” (see below).
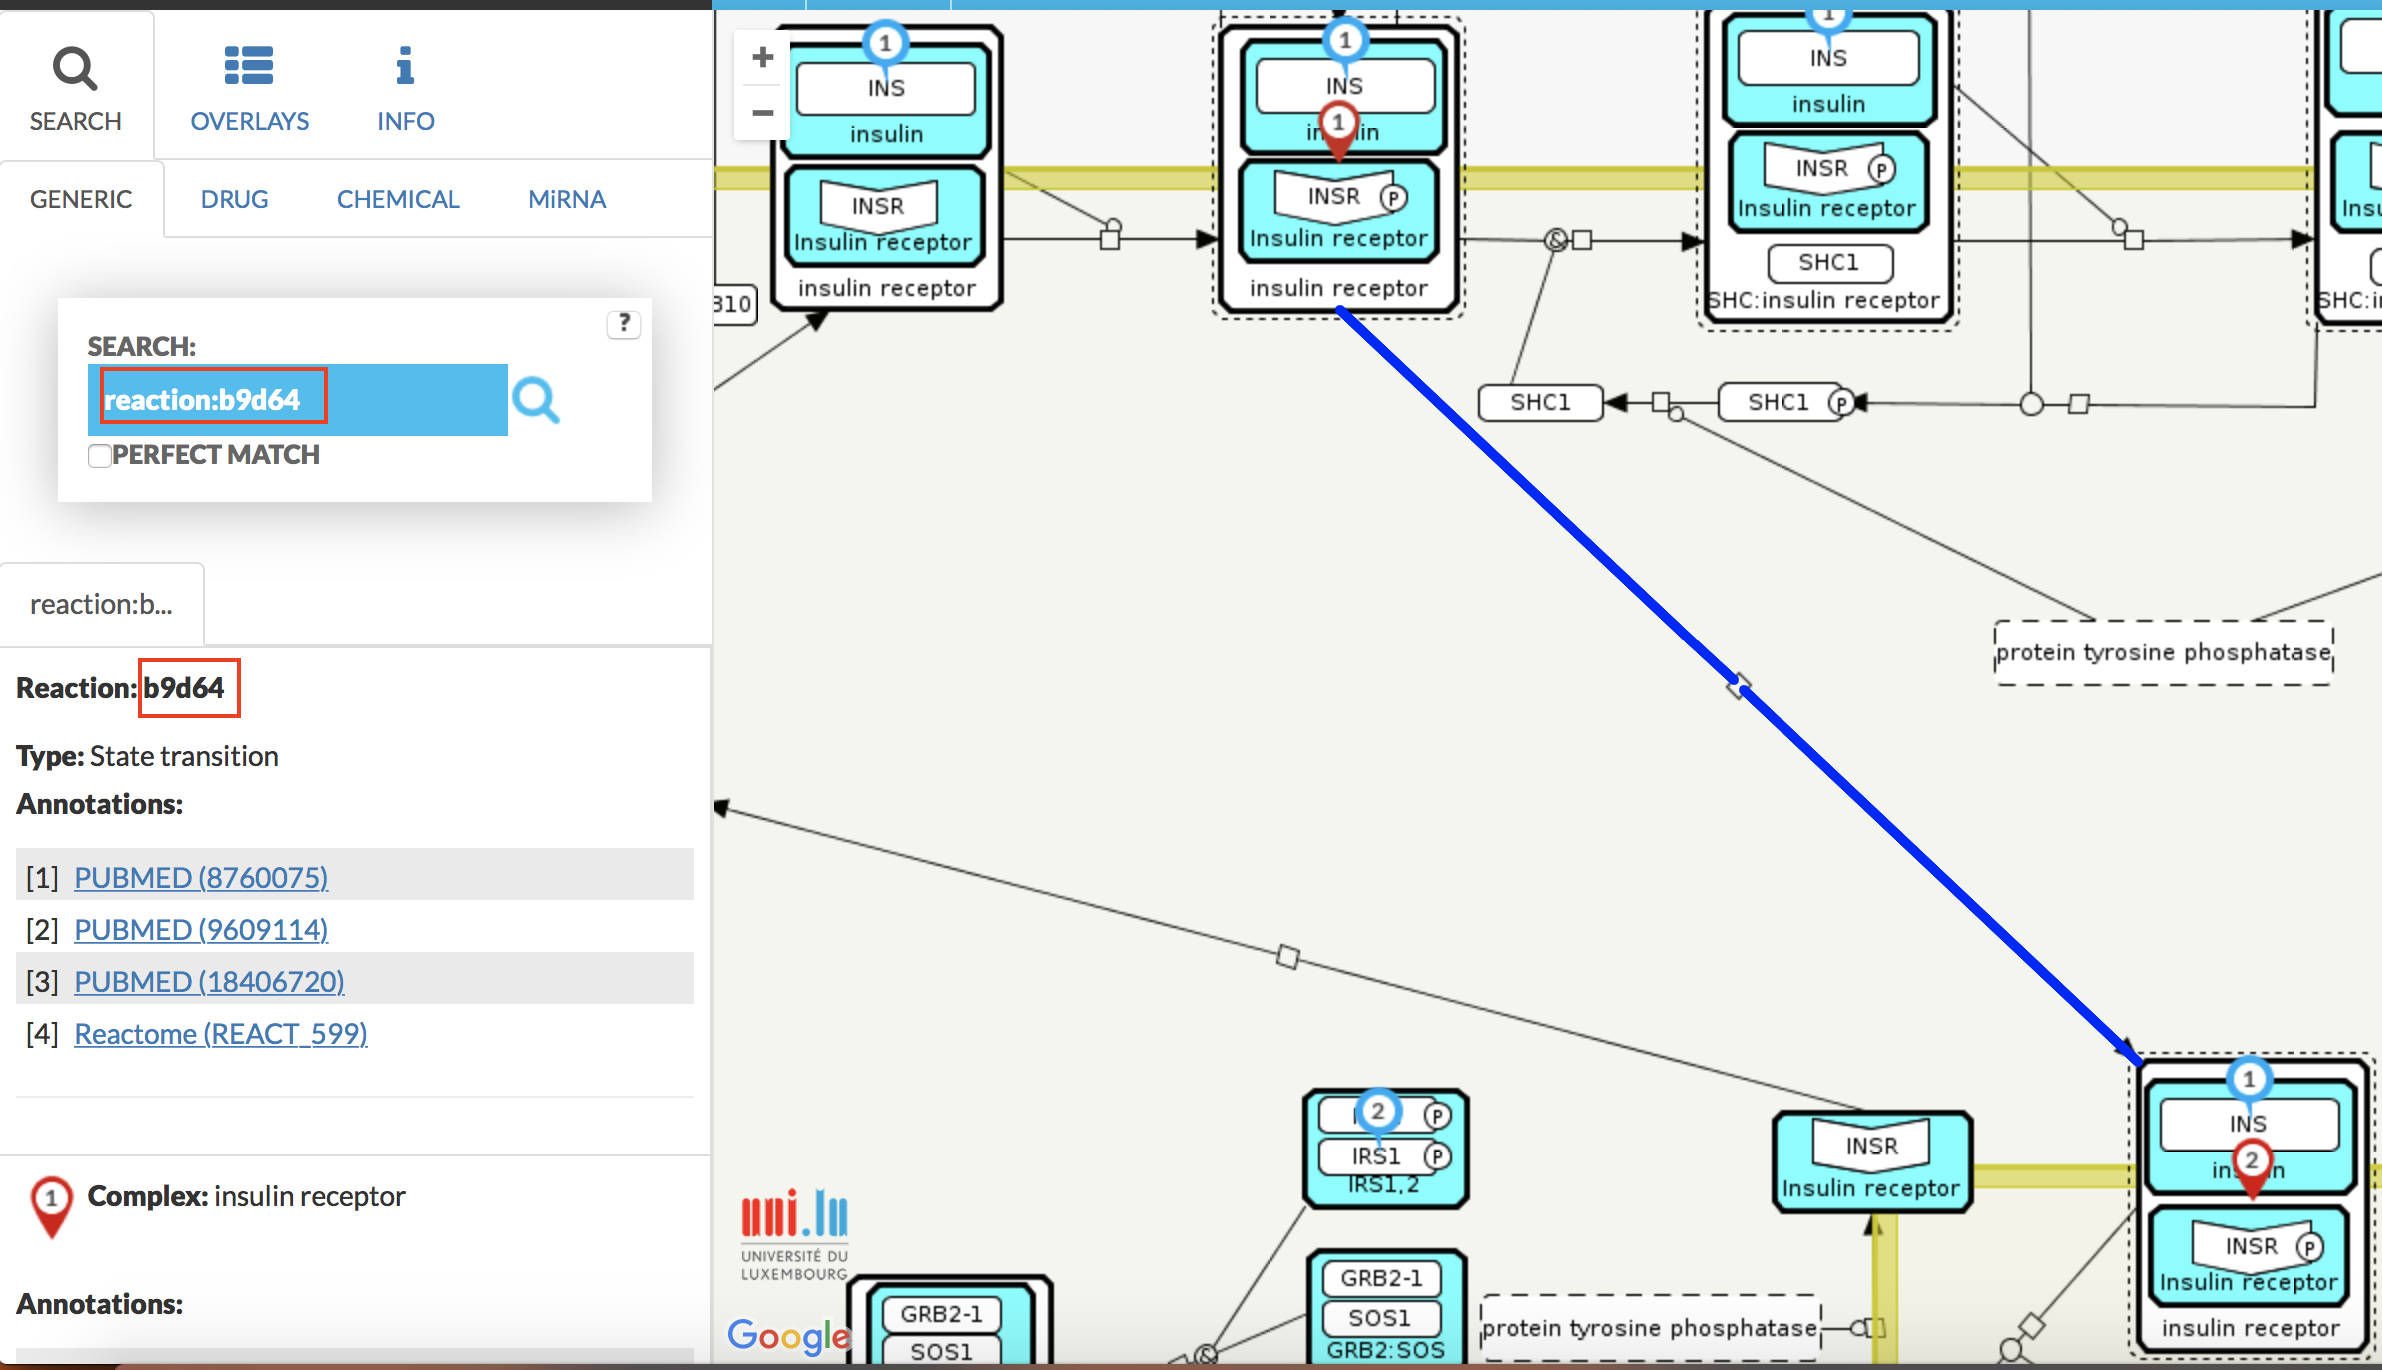 {:width=“500px”}
The search pins indicate hits in the display area. They have different colours for multiple search items and are clickable, showing information as in the left panel.
- Perfect match tick box: If this box is ticked, terms with an exact match to the query will be returned. In the case of large networks or broad queries the search results may be capped to ensure the performance of the system. The limit of displaying search results can be configured via the Admin view (see Admin manual - Configuration).
Direct link to the elements in the display area is possible, as the search query can be provided within the web address of the displayed project. An address has to be manually constructed, directly into web browser, as below:
your.webserver.address/?search='search query'is a link executing the search for a given search query in the default project of your MINERVA instance. For example, an address
your.webserver.address/?search=reaction:xyz123will directly point to an interaction with id xyz123. Referring to a given project on your MINERVA instance requires additionally to pass the project identifier in the address, as shown below. Identifiers of projects are accessible using the Admin view.
your.webserver.address/?id='project id'&search='search query'Drug (targets)#
The Drug scope works as follows. Drug subtab under the the Search tab allows to look for known drugs or their brand names and display their targets in the map. Targets will be marked by pins in the display area. Please, note that they have specific shape, different than the results of other search scopes.
- Search field: type your search query here, separating multiple drug names or their brand names with a semicolon ‘;’. DrugBank www.drugbank.ca and ChEMBL www.ebi.ac.uk/chembl/ will be queried for known targets to be displayed in the map.
- Drug description, synonyms and all known targets will be displayed in the left panel.
Chemical (targets)#
The Chemical scope works as follows. Chemical subtab under the the Search tab allows to look for known chemicals or their synonyms and display their targets in the map. Targets will be marked by pins in the display area. Please, note that they have specific shape, different than the results of other search scopes.
- Search field: type your search query here, separating multiple chemical names or their synonyms with a semicolon ‘;’. Clinical Toxicogenomics Database ctdbase.org will be queried for known targets to be displayed in the map.
- Drug description, synonyms and all known targets will be displayed in the left panel.
microRNA (targets)#
The MiRNA scope works as follows. miRNA subtab under the the Search tab allows to look for miRNAs and display their targets in the map. Targets will be marked by pins in the display area. Please, note that they have specific shape, different than the results of other search scopes.
- Search field: type your search query here, separating multiple miRNAs with a semicolon ‘;’. miRTarBase mirtarbase.mbc.nctu.edu.tw will be queried for known targets to be displayed in the map. Use only mature sequence IDs according to mirbase.org (e.g. hsa-miR-125a-3p)
- known targets will be displayed in the left panel.
Overlays tab#
Overlays tab allows to display or generate custom coloring of elements and interactions in the map. It is composed of two sections - general overlays and custom overlays (see figure below).
- View column allows to
- Change to viewing mode (click the magnifying glass icon) allowing to switch between
- Pathways and compartments (hierarchically masked content)
- Network (only colored network structure shown)
- Empty (only network structure, no coloring, recommended for data display)
- Display multiple overlays (tick chosen checkboxes)
- Change to viewing mode (click the magnifying glass icon) allowing to switch between
- Data column contains buttons, where applicable, allowing to download the dataset used to generate the overlay. Mouse over the button displays a short description of the dataset, if provided on upload.
Overlays are also visible in the popup menu, with the value and the sign marked on the horizontal color bars (see figure below).
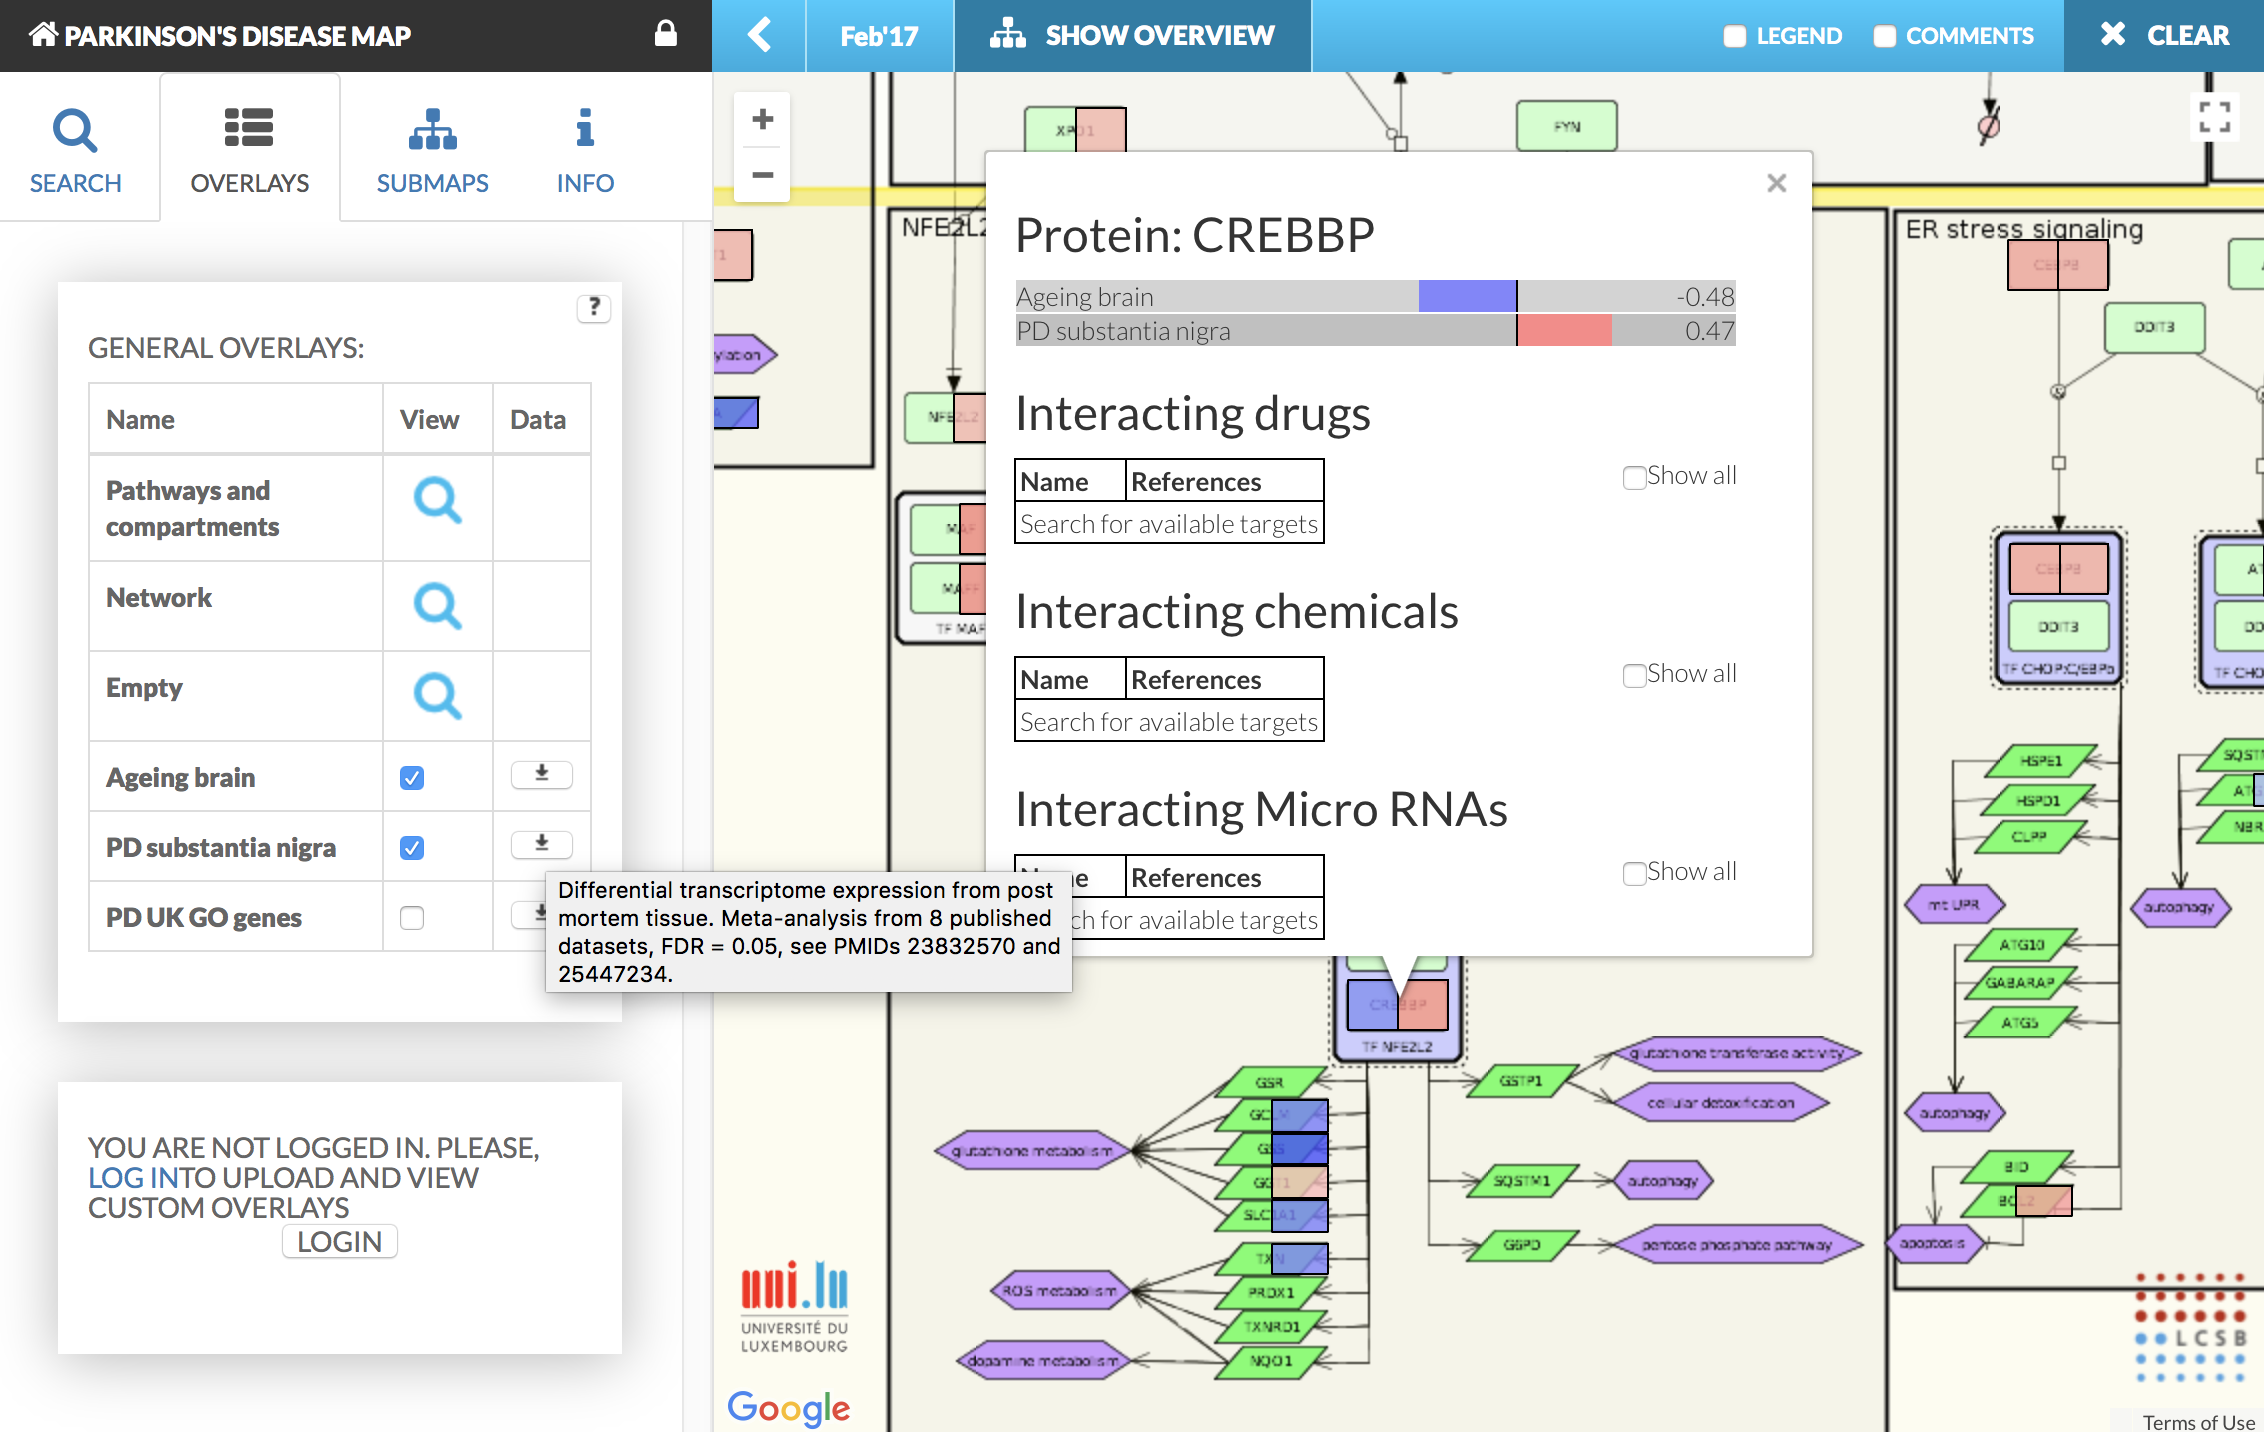 {:width=“800px”}
In the figure above:
- General overlays are overlays accessible for every user viewing the content
- User-provided overlays menu becomes available upon login (see below).
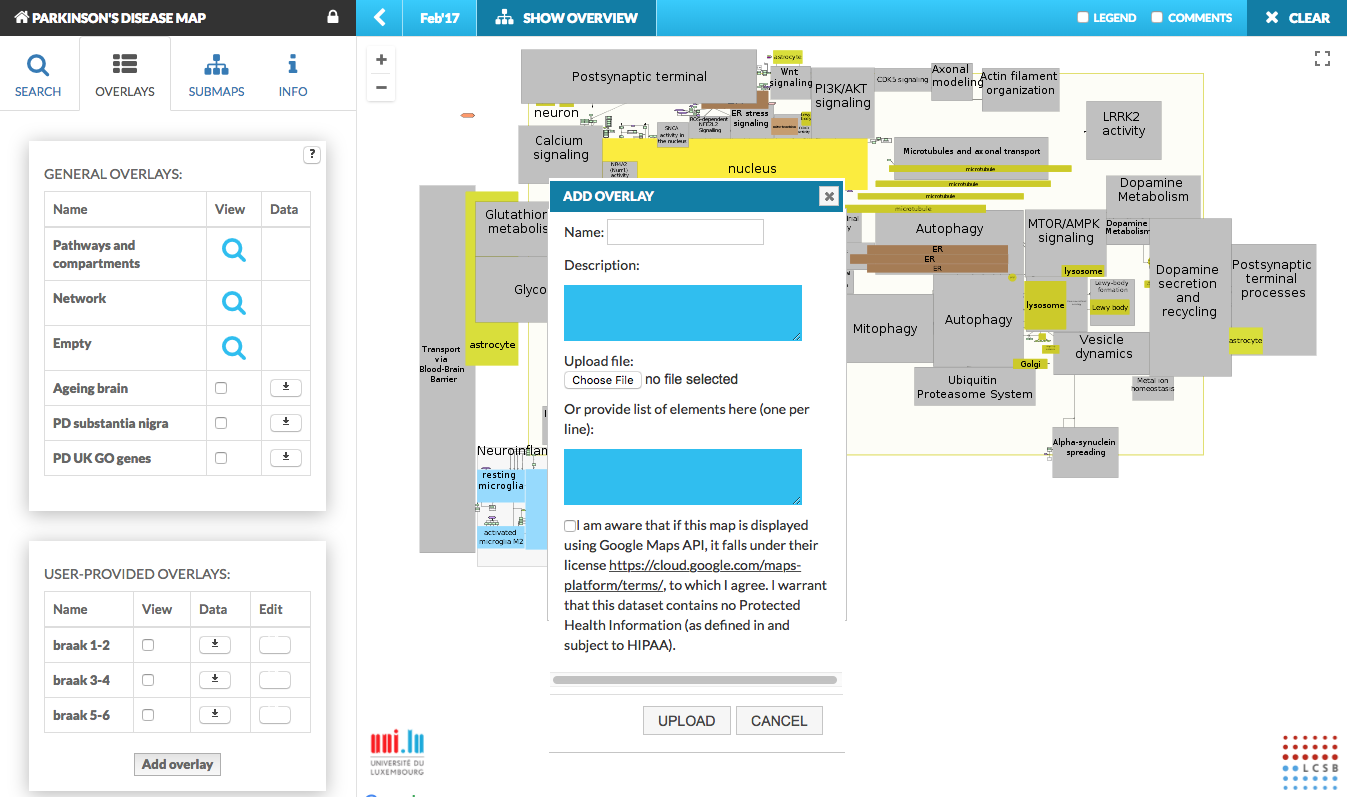 {:width=“900px”}
User-provided overlays part contains the following elements (above):
- List of uploaded overlays containing
- View column with buttons enabling switching between User-provided overlays
- Data column with buttons allowing the user to download the dataset used to generate the overlay. The users have access only to their respective datasets.
- Edit column with buttons allowing the user to provide description to the uploaded datasets
- Add overlay button invoking the dialog window with the following components
- Name field for the new overlay
- Description: description of the dataset
- Choose file button to select a file with overlay data
- List of elements field - instead of providing an overlay file, the user can provide a list of named elements to highlight in the map (e.g. list of genes)
- Upload button to generate the user-define
Upload user-provided overlay data#
Format
For examples of basic and advanced data upload, see Examples - user-provided overlay data upload by registered users. Description of the format follows below.
Basic format The basic format of file containing the uploaded data is two-column, tab-separated text file, with the columns Name and Value.
- Name column contains the names of elements to be colored
- Value column contains the values normalized to [-1,1] range.
Basic format will match names of the elements provided in the Name column among the names of elements in a given network and for the matching ones will assign them colors: blue for negative values, red for positive values, with the saturation proportional to the value. The color range for the data upload is customizable in the admin panel.
Advanced format The advanced format allows for by identifier matching, custom color assignment and coloring of interactions. Advanced format foresees two parts of the uploaded dataset - header and body.
Header lines have to start with ‘#’. It can contain the following elements:
- Version
# VERSION=xyz- a version of this custom overlay - Name
# NAME=xyz- a name that will be automatically assigned upon upload - Description
# DESCRIPTION=xyz- a description that will be automatically assigned upon upload
Body is a table with a following set of allowed columns:
- Name, Value - same as in basic overlay
- Compartment - name of a compartment in which coloring should take place Warning! Coloring compartments works ONLY for separate (not nested) compartments. Setting a color for elements in a compartment that encloses other compartments sets the color in the nested compartments as well.
- ChEBI - ChEBI identifiers of elements to be colored
- Entrez gene - Entrez identifiers of elements to be colored
- Gene ontology - Gene Ontology identifiers of elements to be colored
- Ensembl - Ensembl identifiers of elements to be colored
- HGNC symbol - HGNC symbols of elements to be colored
- UniProt - UniProt identifiers of elements to be colored
- ReactionIdentifier - ID of interaction to be colored (interactions coloring only)
- LineWidth - line width of the colored interaction (interactions coloring only)
- Color - color of the colored element.
The dataset for upload may be integrated and sparse, i.e. a document may contain all columns at once, and, where irrelevant, their content may be left blank. In other words, you can color interactions and elements in the same dataset, leaving blank fields in ReactionIdentifier and LineWidth for elements, and leaving blank fields in Name for interactions.
Procedure
After choosing the dataset to upload, pressing Upload button will invoke a comment, initiate generation and reduce the amount of available custom overlays (see below, left).
You will be notified by email when your overlay is ready. The email will also contain the list of elements in your dataset not found in the map.
Important reminder:
- The number of available overlays is configured in the Admin view (see Admin manual - User manager)
- The number of available overlays is common for all projects hosted on your MINERVA instance. If a user is registered in a number of projects and uploads custom datasets in all of them, the global number of available custom overlays will be reduced with each uploaded overlay.
Submaps tab#
The Submaps tab summarizes all the submap networks uploaded together and linked to the main network of this project hosted by your MINERVA instance. See Admin manual - Source file to learn how to upload the submaps together with the main file. The tab “Submaps” is visible in the left panel, only if the map contains any submap.
The Submaps tab contains the Name column, and the column with the buttons invoking corresponding submaps. The submaps show as a pop-up window on top of the main map, and are synchronized with respect to search queries and displaying mapped experimental data. This means that search results and search target bubbles will be visible in the main map and the displayed submaps. Similarly, coloring for overlays are mirrored in the submaps (see figures below).
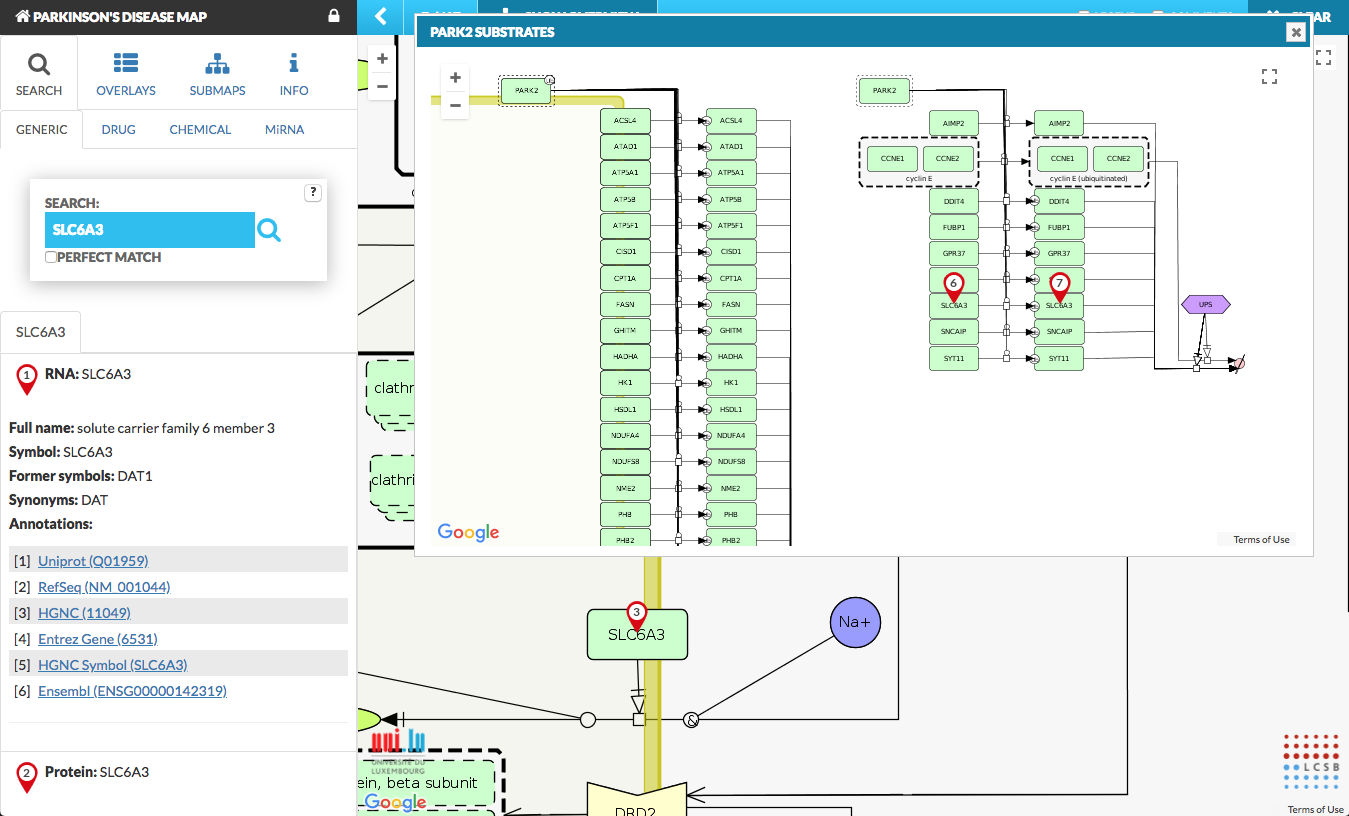 {:width=“800px”}
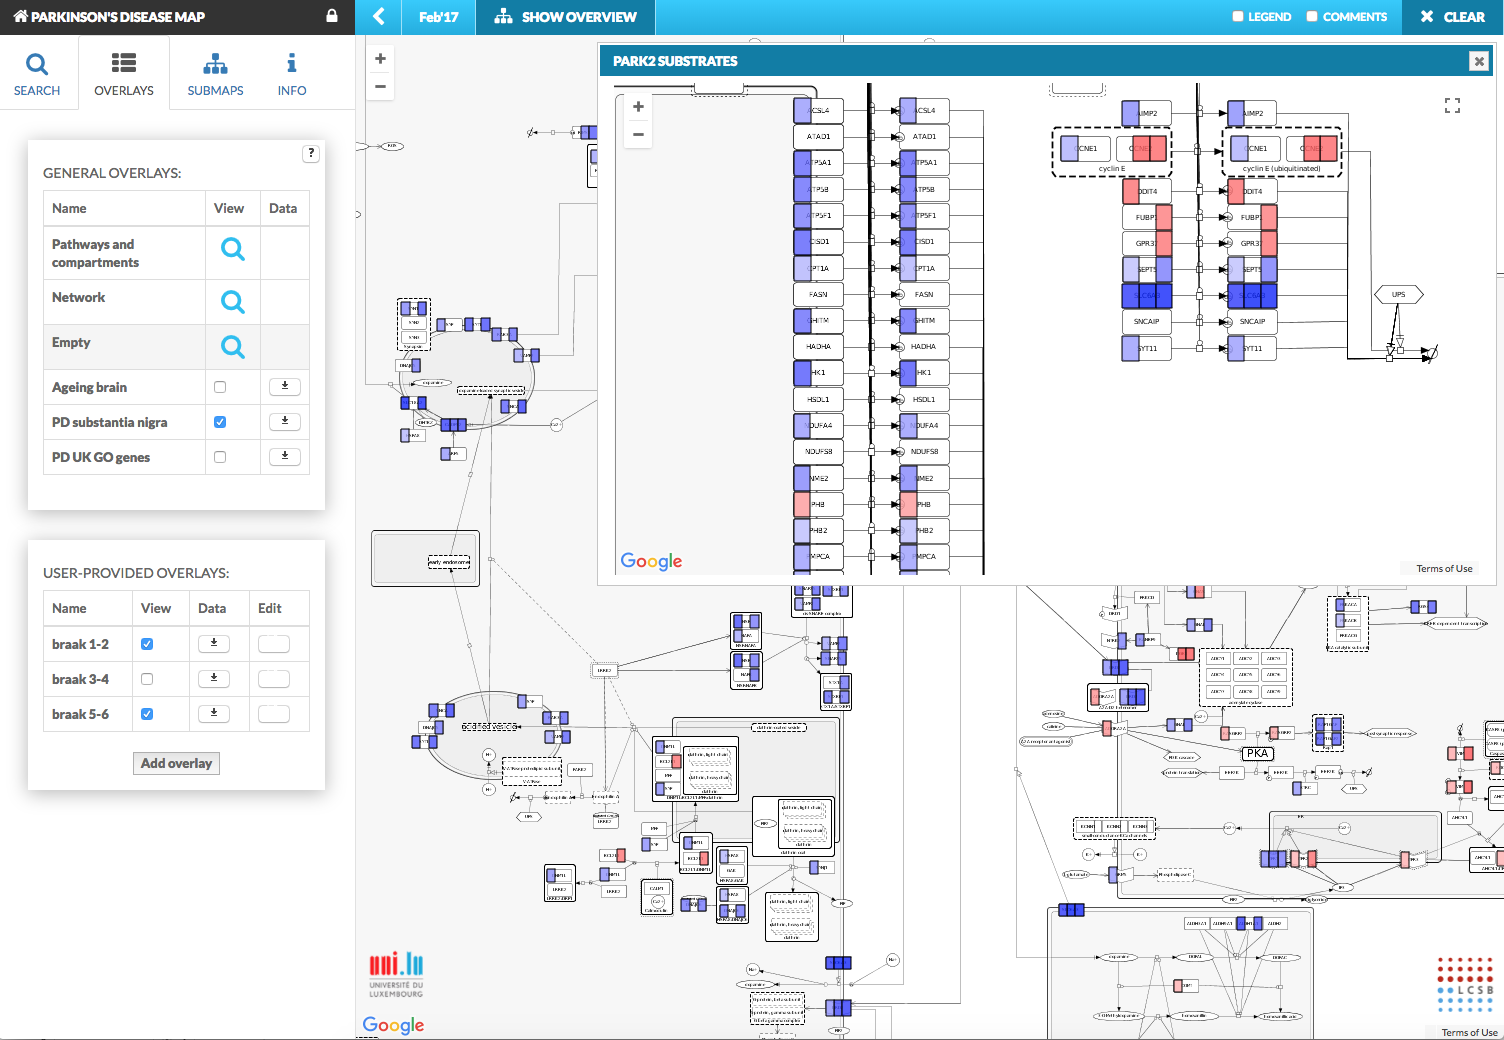 {:width=“800px”}
Info tab#
The Info tab has two components, displaying Project info and User data (for registered and logged in users).
Project info#
Displays Name, Version and Description of the map.
The Data section features four links, allowing the user to:
- browse the publications supporting the map. The Publication list dialogue allows to search for articles by title or author names, and contains links to interactions supported by particular articles.
- download the source files
- export the contents of the map (see below)
- open the manual
The export page contains three tabs, allowing to download the hosted content in different formats.
- Elements export tab allows to narrow down and download the list of elements in the hosted networks. Available filters include:
- Type - filters the exported elements by the SBGN-compliant type
- Columns - filters the contents of exported file by selecting, which columns should be included (see below).
- Name - name of the element
- Compartment - compartment containing the element
- Component - CellDesigner specific, TextArea covering the element, see also Section 4.1.4. Content curation
- Type - SBGN type of the element
- Id - identifier in the system
- Parent complex - complex element containing this element
- Submodel - name of the subnetwork containing this element
- Annotations - filters the annotations of elements in the downloaded file; by default all annotation types are considered
- Included/excluded compartments - filters the elements by compartments they are in; by default all compartments are considered as “included”, none as “excluded”.
- Network export tab allows to narrow down and download the interactions in the hosted networks. Importantly, the exported network file is not a fixed-column table. As interactions are in fact hyperedges, each line may contain different number of reactants, products and identifiers. Available filters include:
- Nodes - filters the nodes of exported interactions by the SBGN-compliant type
- Annotations - filters the annotations of elements and interactions in the downloaded file; by default all annotation types are considered
- Included/excluded compartments - filters the elements by compartments they are in; by default all compartments are considered as “included”, none as “excluded”.
- Graphics export tab allows to download graphics of the map in the SVG format.
User data#
It allows a registered user to type in their login and password, or to request for an account from the administrators of this MINERVA instance. Platform administrators can register new users (see Section 3.4 User manager) and configure Request an account functionality (see Admin manual - Configuration)
After login, this panel displays information about the user. After the successful login the user gains the possibility to upload custom overlays (see Section Overlays).
Information bar#
Information bar is the topmost part of the user view, containing the Show overview button, Comment and Legend checkboxes and Clear button. The Clear button clears all search results currently shown in the display area. The remaining functionalities are detailed below.
Show overview#
This button invokes a static image associated with the displayed content. It may be a graphics facilitating the understanding of the underlying network, or any other visual cue that the content curator decided to present. The initial image displayed with the Show overview button can be linked to:
- another static image to be displayed next
- a defined area in the displayed content
- a set of elements or interactions.
Detailed information on how to configure Show overview images display is provided in Admin manual - Source file.
Comments#
If this checkbox is checked, the comments provided by users with Pinned option set to Yes will become visible in the display area (see also Section Add comment).
Legend#
If this checkbox is checked, the legend describing element and interaction types will be displayed.