Overlays#
Overlays generate custom coloring for elements and interactions in the map.
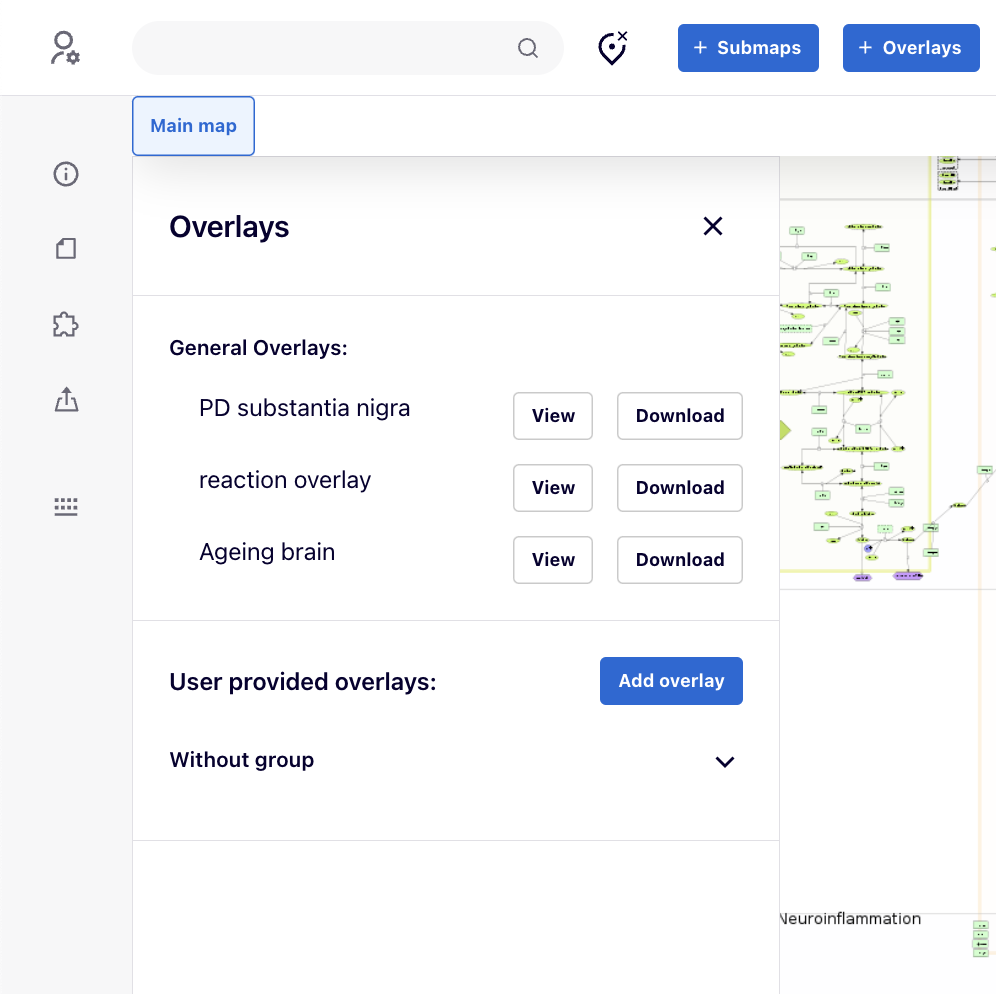
Working with overlays#
Users can view and download available overlays. By pressing “View”, the background of map automatically changes to Empty to remove any background color so that to have a better emphasis on the overlay’s color. The “Download” button allows you to download the dataset used to generate the overlay.
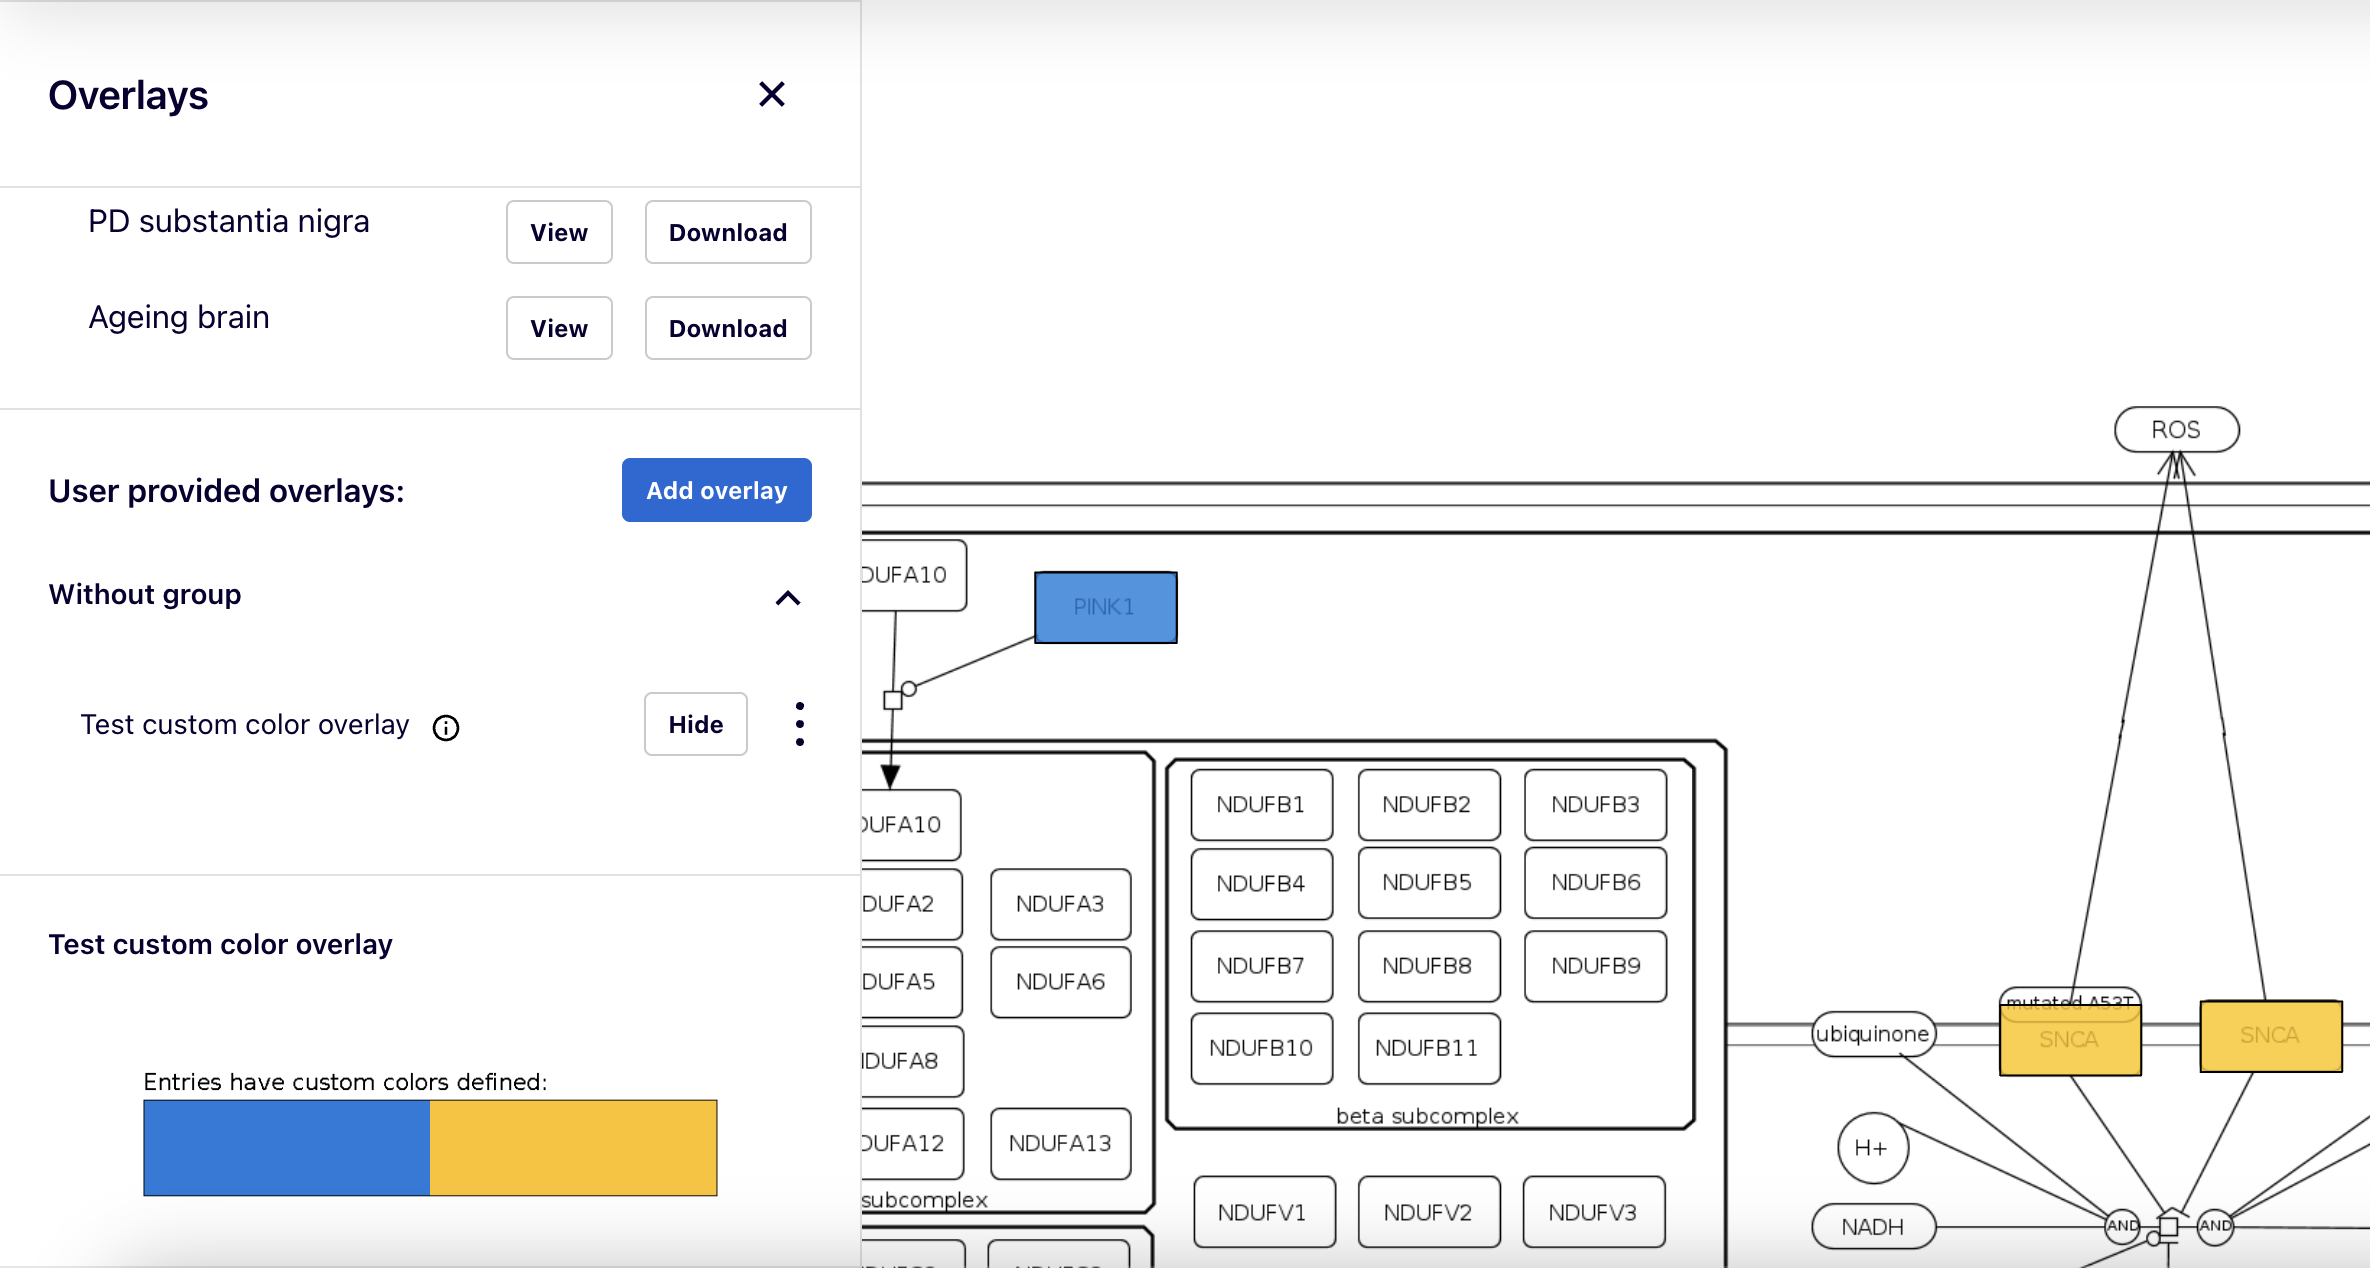
Overlays of custom colors#
Overlays assign fixed colors to elements. Within a single overlay, more than one color can be assigned to a single element. These multiple colorings will be shown as horizontal stripes. More than one overlay can be viewed at a time, with vertical segments corresponding to each overlay.
After clicking on an element of the map, overlay data for this element are visible in the left panel as one or more horizontal color bars.
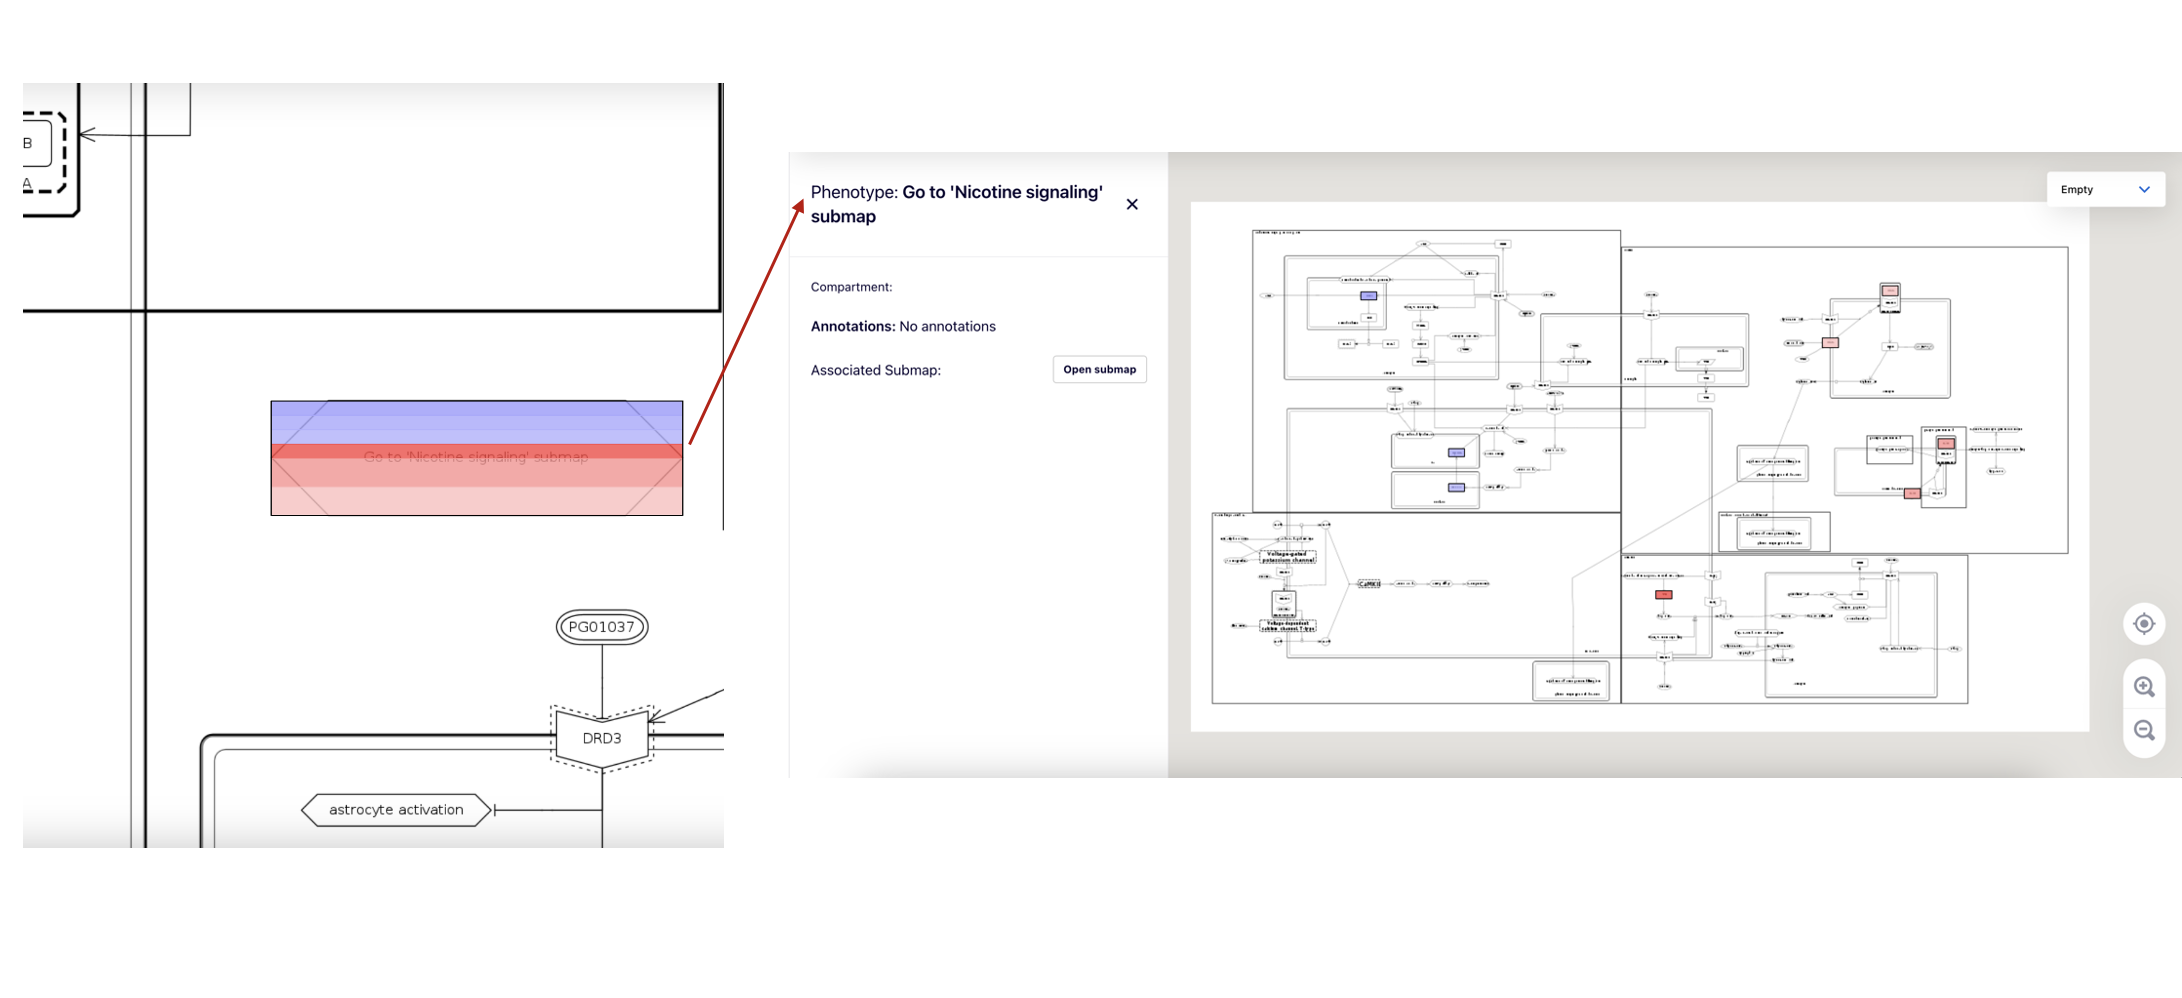
If an element represents a submap, its coloring summarises to the overlay of the underlying submap.
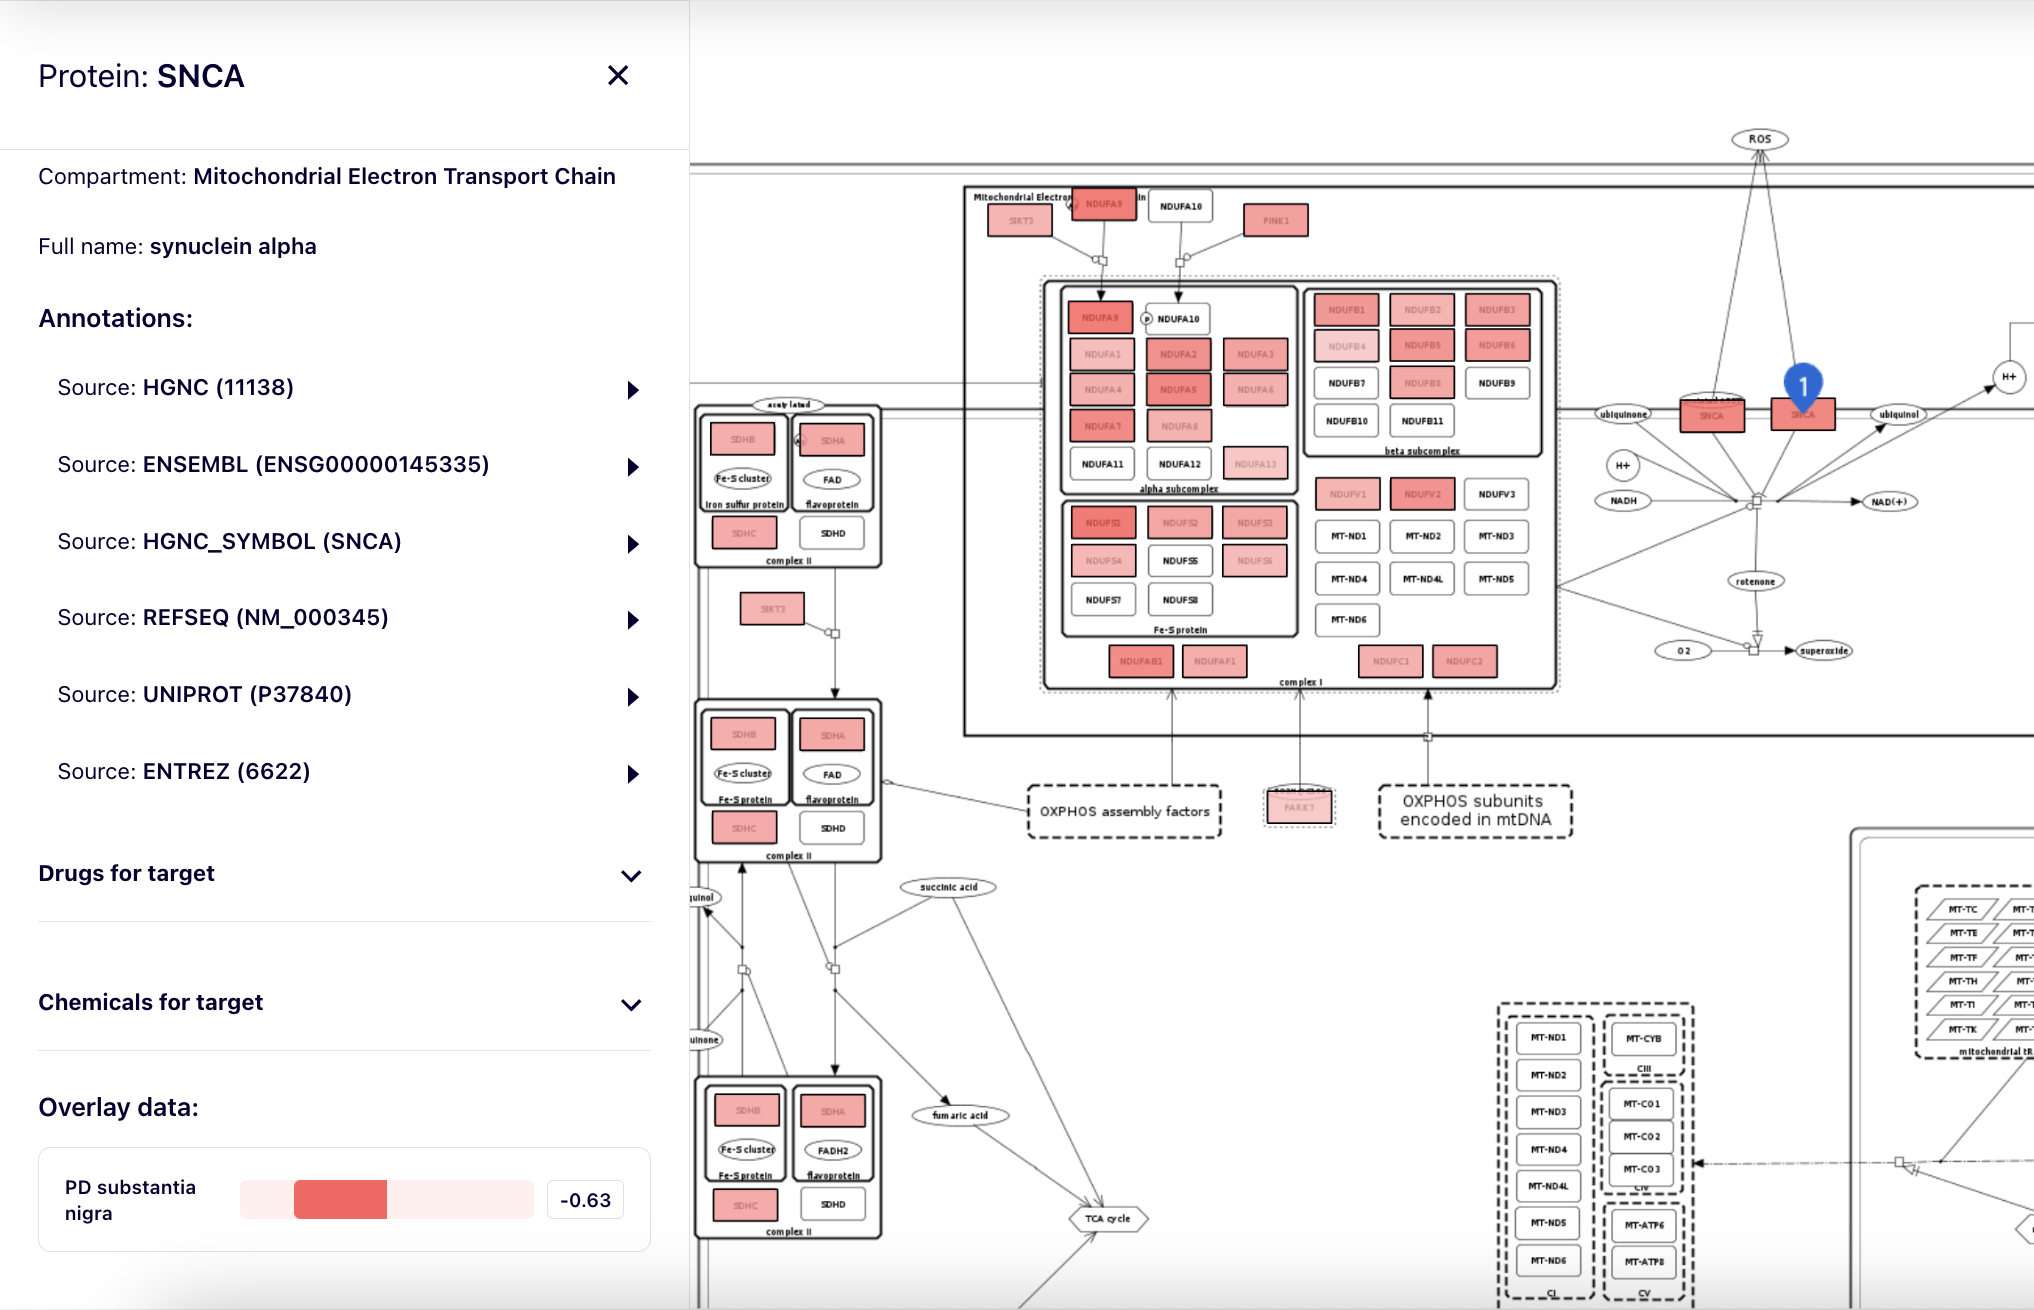
Overlays by value range#
Overlays can color elements according to values from [-1,1] range. This allows visualisation of experimental data, for instance differentially expressed molecules. For that purpose, expression values have to be normalised to [-1,1] range. Visualised color range can be configured individually for each MINERVA instance.
After clicking on an element of the map, overlay data for this element are visible in the left panel as one or more horizontal color bars, together with the values.
Overlays of genetic variants#
Under development. The ‘genetic variants’ overlay was redesigned and the documentation will be updated soon.
User provided Overlays#
The overlays provided by the user, are private and visible only to the currently logged-in user.
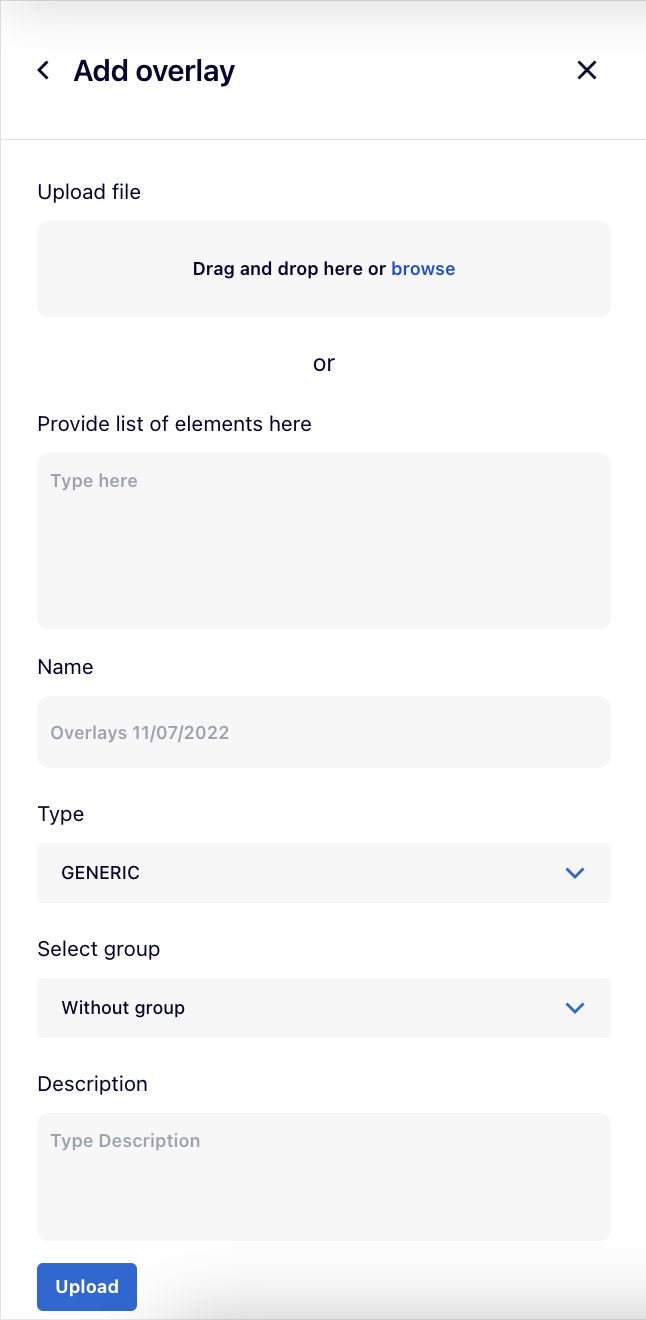
Using the  button, users can add their own overlay:
- Upload file with the overlay’s dataset or Provide list of elements as the overlay’s dataset in the designated box.
- Name for the overlay.
- The Type field depends on the header of the uploaded file. After selecting it, the dropdown list for Type automatically switches between GENERIC and GENETIC_VARIANT, as MINERVA recognizes the file’s header because genetic variant overlays require a specific header field.
- A GENERIC overlay displays coloring on the map according to the dataset of indicated molecules (e.g., differentially expressed genes).
- A GENETIC VARIANT overlay displays a coloring for the genes, for which the variants are present. It also enables the genome browser popup, displaying the position of a variant in the sequence of the corresponding gene. To upload and correctly display the genomics information your instance must contain reference genomes, uploaded by the administrator. Also, the Organism id (e.g. 9606) must be provided for the project, and reference genomes uploaded on MINERVA instance must include its type.
- Select group
- Description for the overlay (optional).
After clicking on  button, your overlay will become available in the left panel.
Plugins#
Plugins allow users to create client-side custom visualizations, independent of the core functionalities of MINERVA.
By clicking on the ![]() icon, two panels, left and right, will appear.
icon, two panels, left and right, will appear.
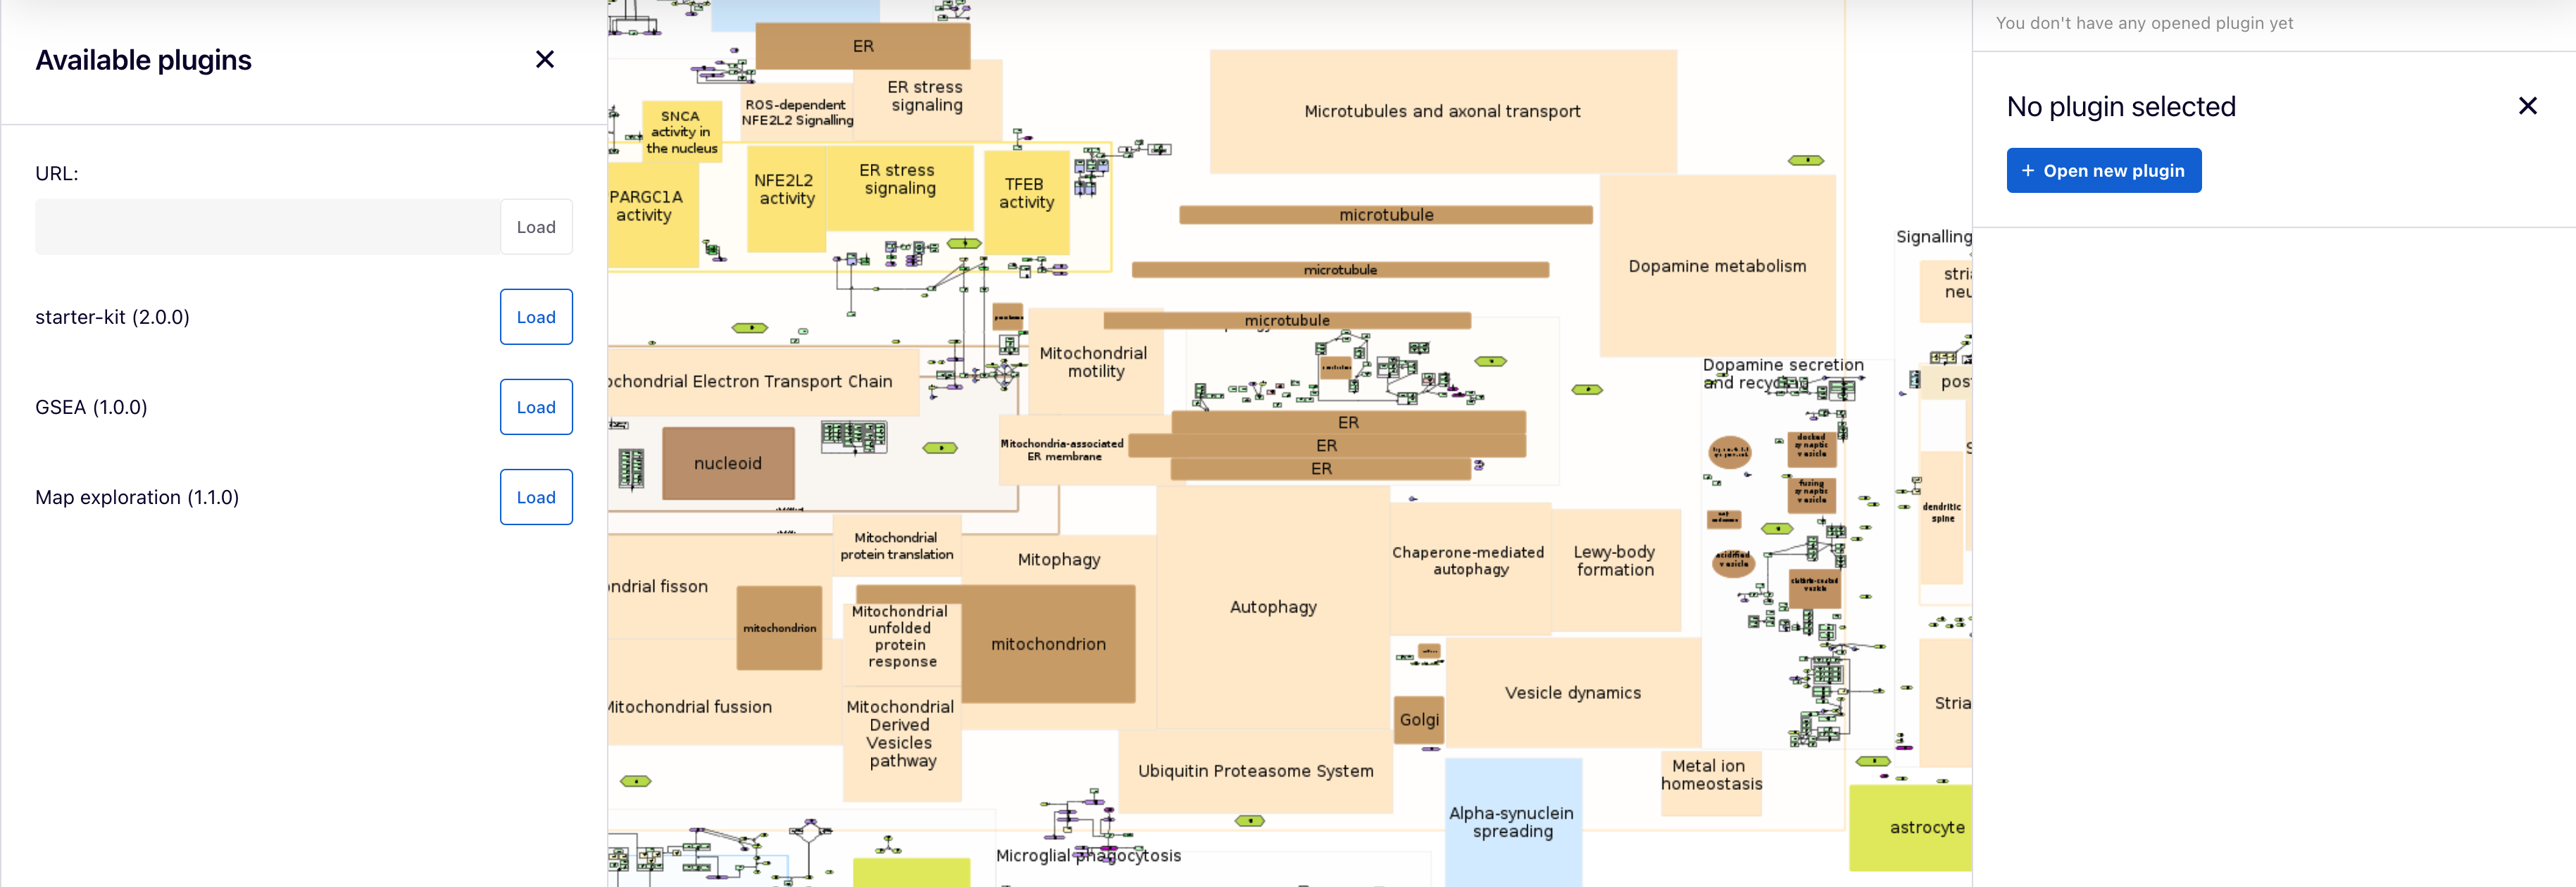
Available plugins for all users are uploaded by admins on the MINERVA platform and are listed in the left panel, where users can load each one. Also, each plugin can be selected in the right panel by clicking on the  button.
Additionally, users can supply a URL to a plugin written in JavaScript in the URL field. To learn how to write your own plugins, visit the “Plugin starter kit” repository.
Example plugin: Enter the provided URL into the ‘URL’ field and click the ‘Load’ button:
https://minerva-service.lcsb.uni.lu/plugins/gsea/plugin.js
Please find below the list of available plugins, click at plugin’s name for its details.
| Name of the plugin | Address URL and the short description of the plugin |
|---|---|
| Map exploration | Enhance the visualization and exploration of molecular interaction in the map. https://minerva-service.lcsb.uni.lu/plugins/exploration/plugin.js |
| GSEA | Calculate the enrichment of the elements from the selected overlay in the pathway. https://minerva-service.lcsb.uni.lu/plugins/gsea/plugin.js |