Point and Click#
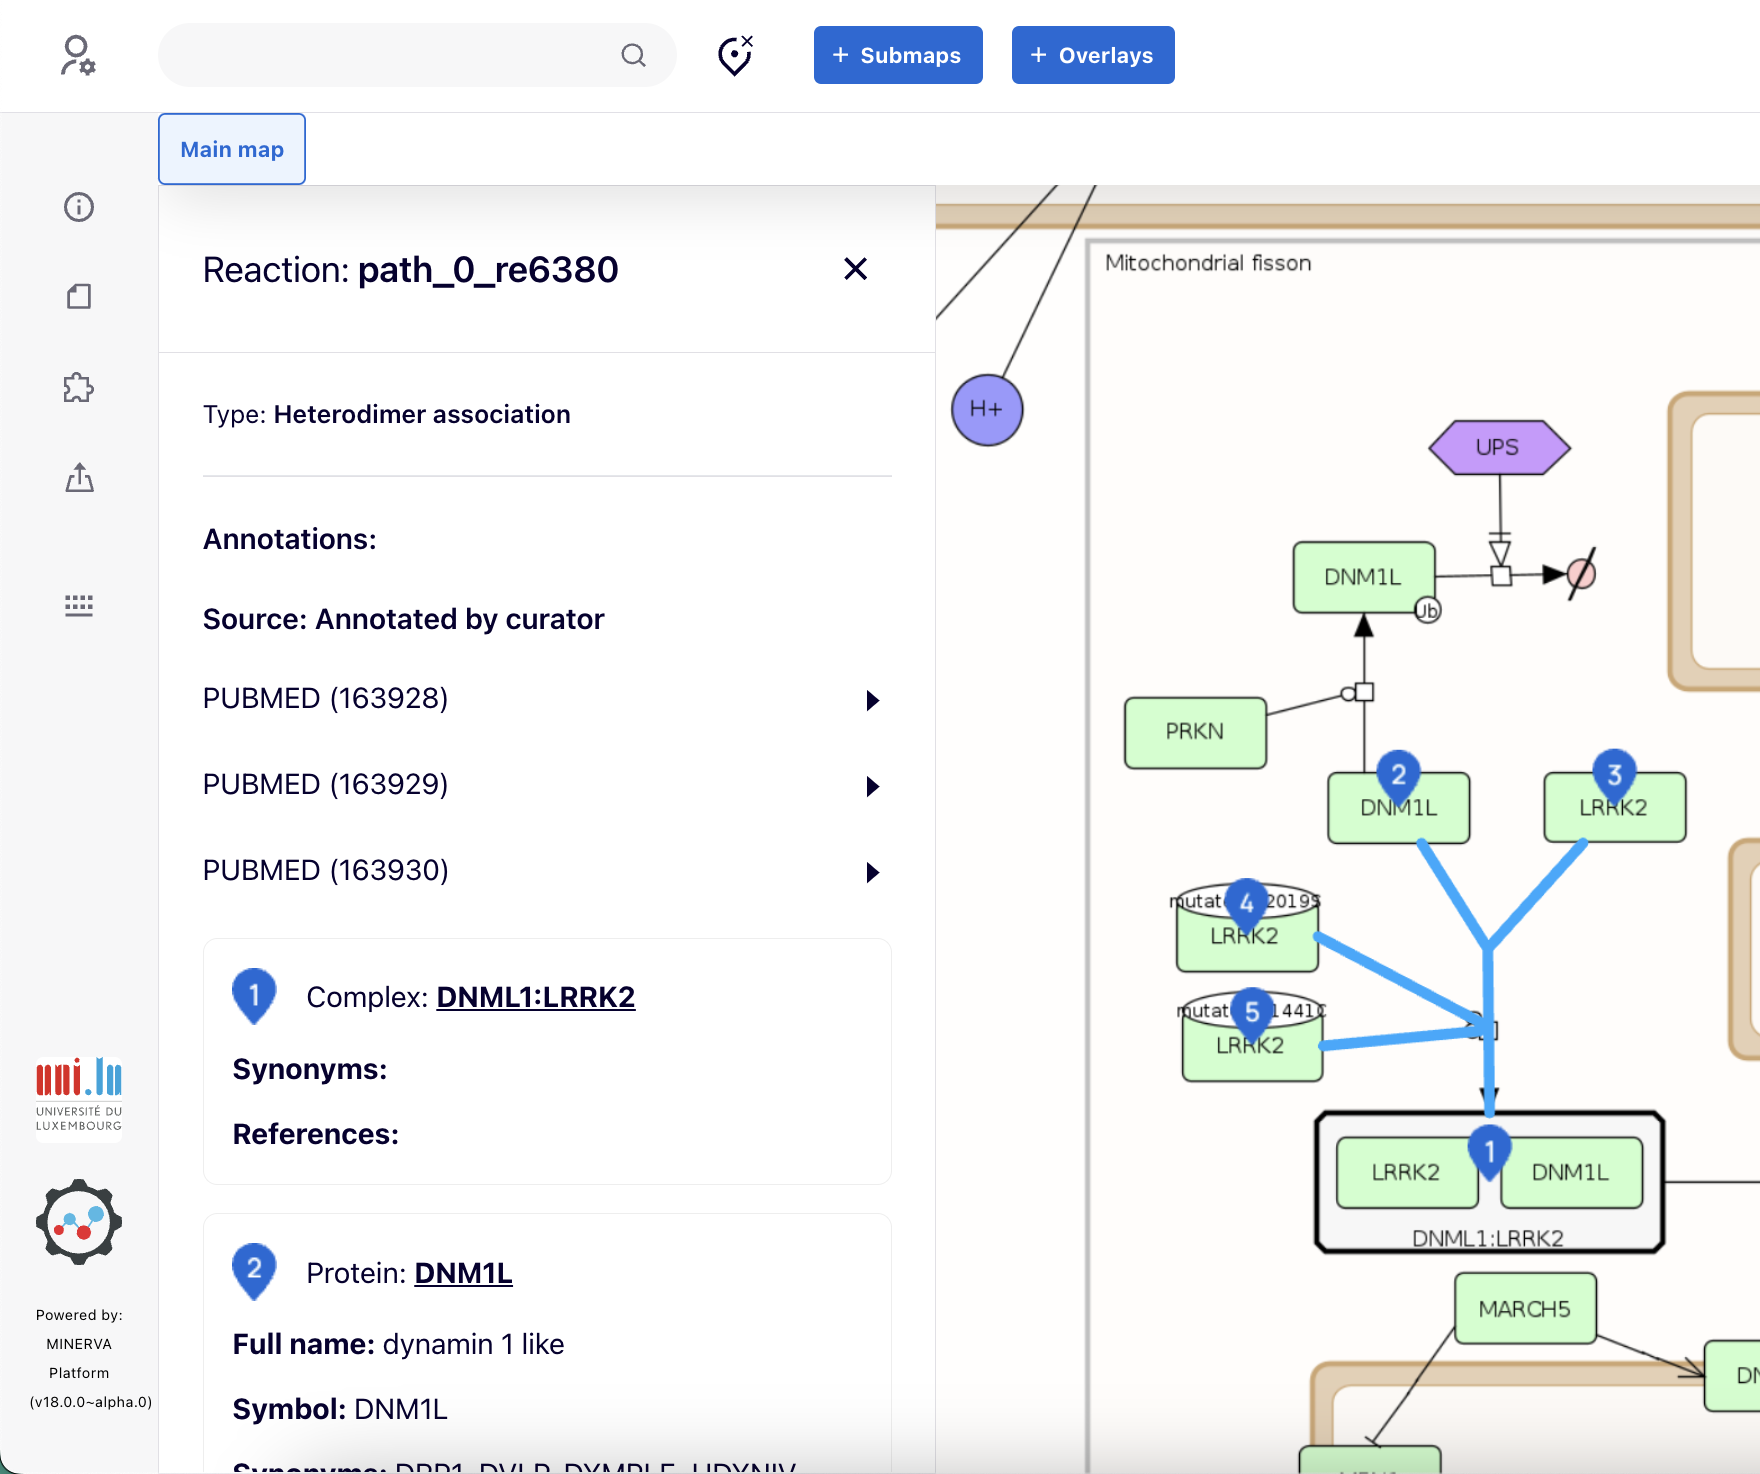
By clicking on any element (left image) or the interactions between them (right image) in the display area, the elements will be highlighted with a colored pin  and the reactions will also be colored. Click on the Clear button
  to deselect the selected pins or reactions and clear the map.
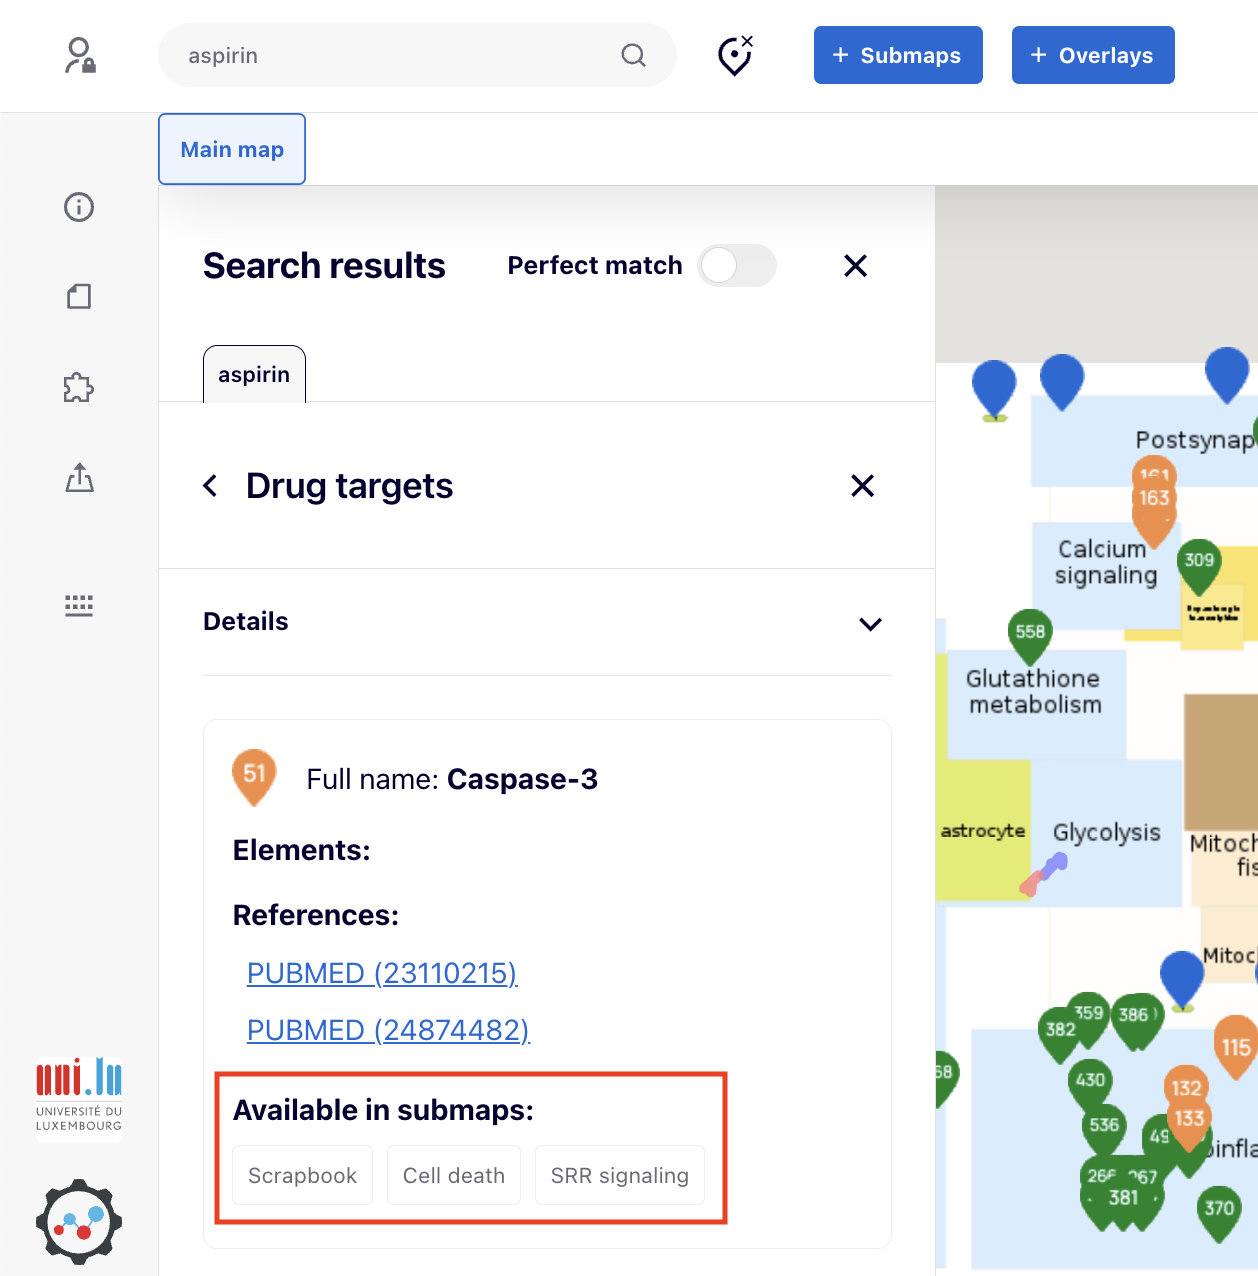
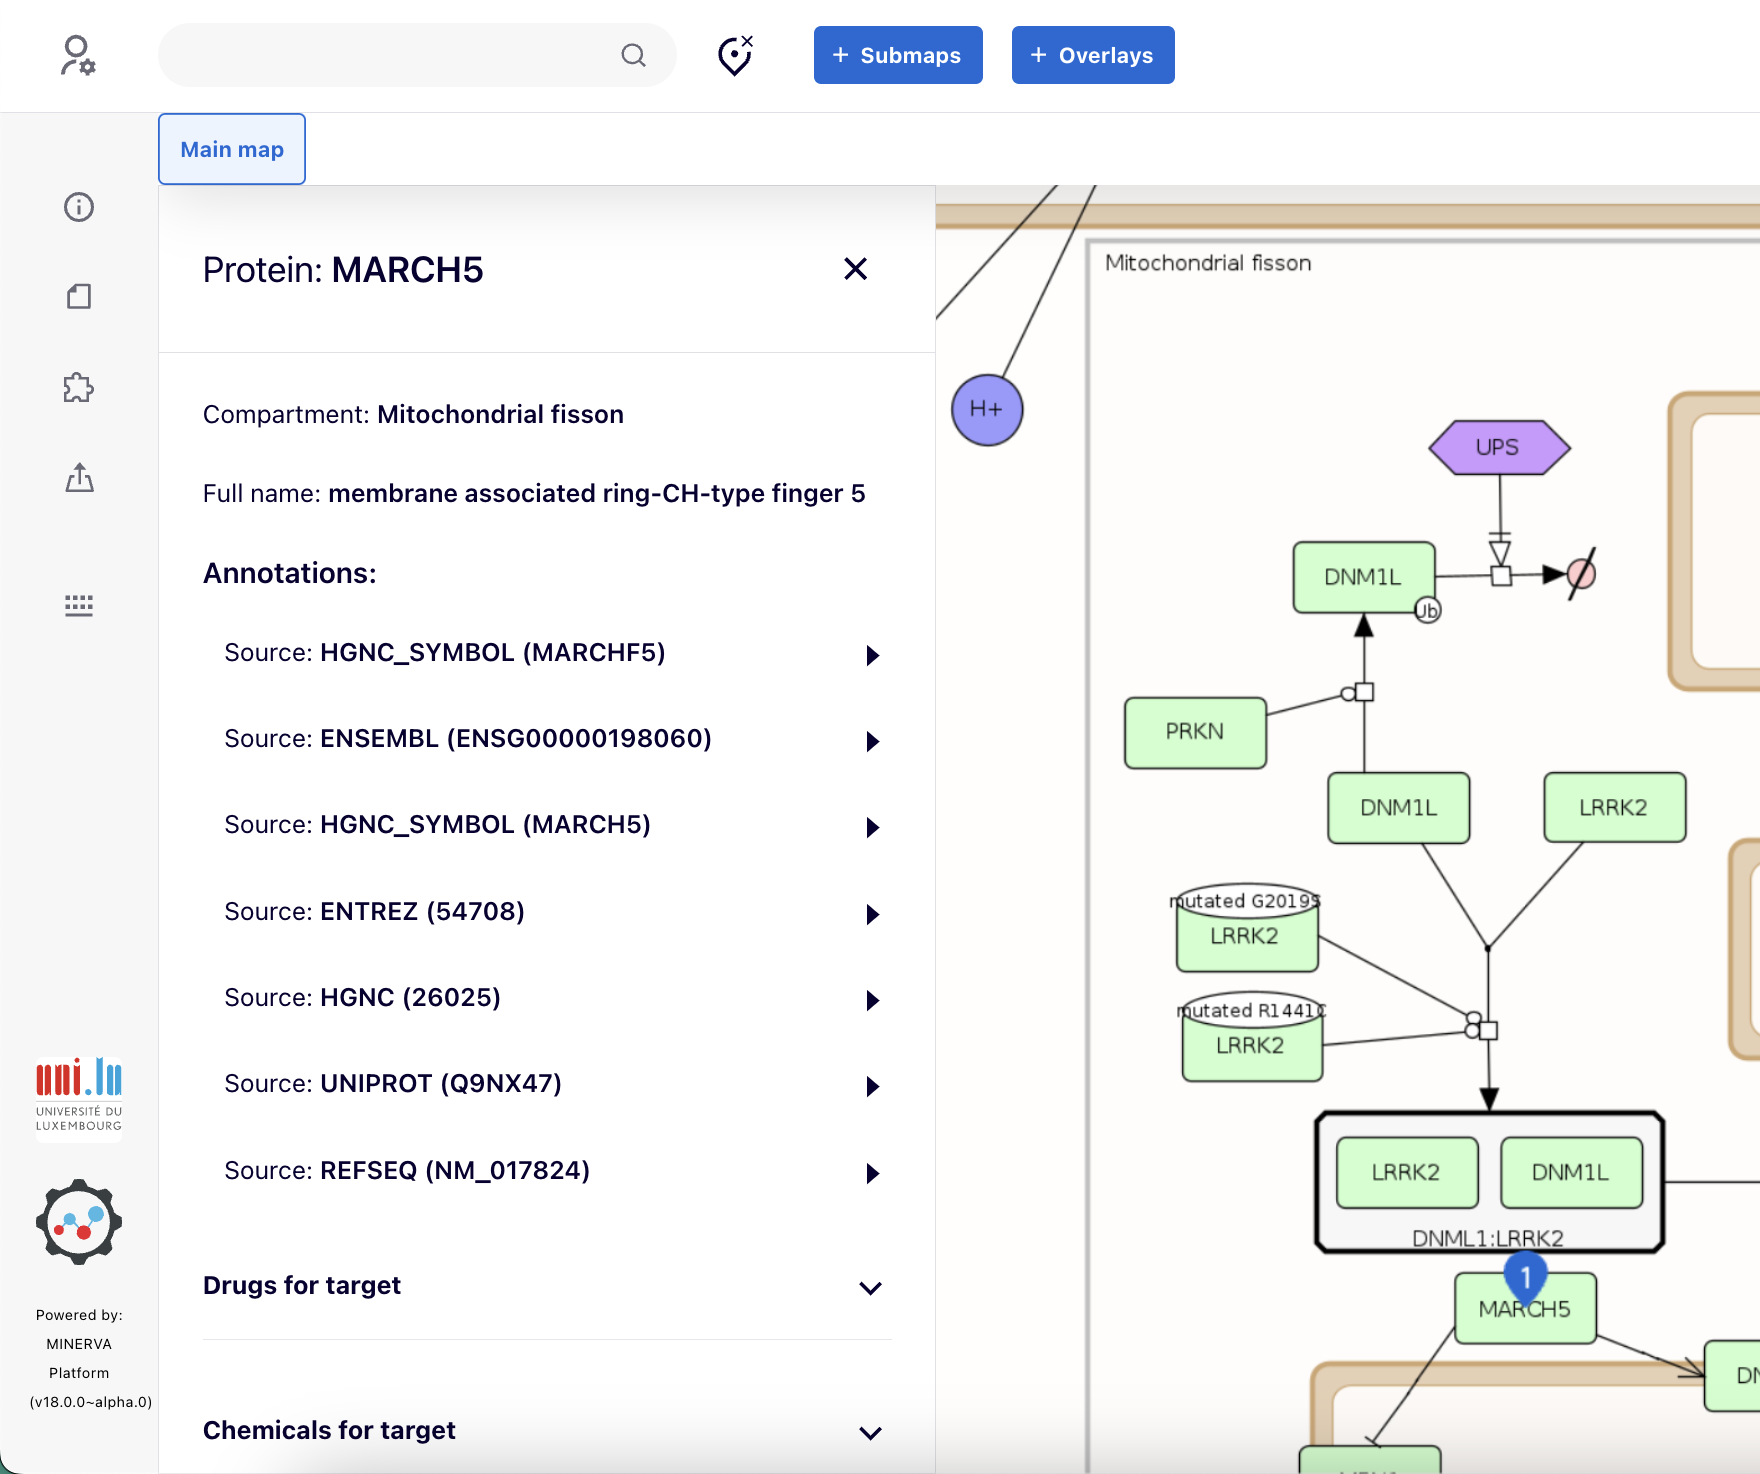
In general, the information about an element or a reaction is displayed on the left panel. Users can find the element’s name, the compartment it is inside, and the annotations for this element. Additionally, for each element annotated with HGNC symbol, the user can explore drugs and chemicals targeting this element. The results are taken from DrugBank and ChEMBL and CTDbase. See more under drug/chemical targets list.
Clicking on any reaction on the map will display the reaction’s name and the details of the reactants in the left panel.
Background#
On the top right corner of the map, there is the Background dropdown button where one can choose the background of their map be:
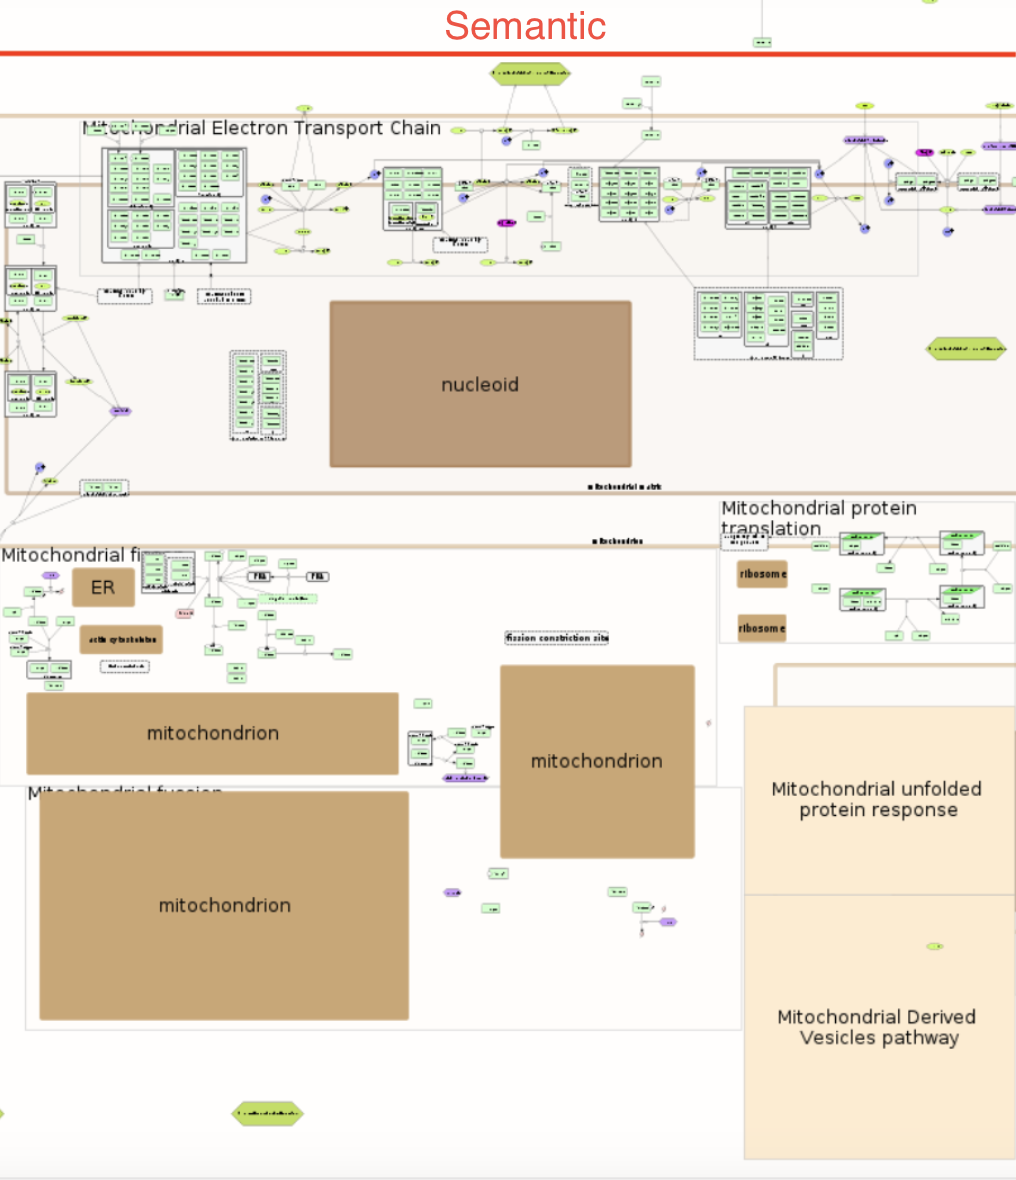
Semantic is the default background for the map. The main feature of this view is Semantic zoom which enhances map’s clarity. This view is generated procedurally, with areas overlaying others based on the content assigned to the appropriate zoom levels. In this view, at higher levels of zoom, larger areas overlay smaller ones, and the contents of complexes are masked. For more information, please refer to this page
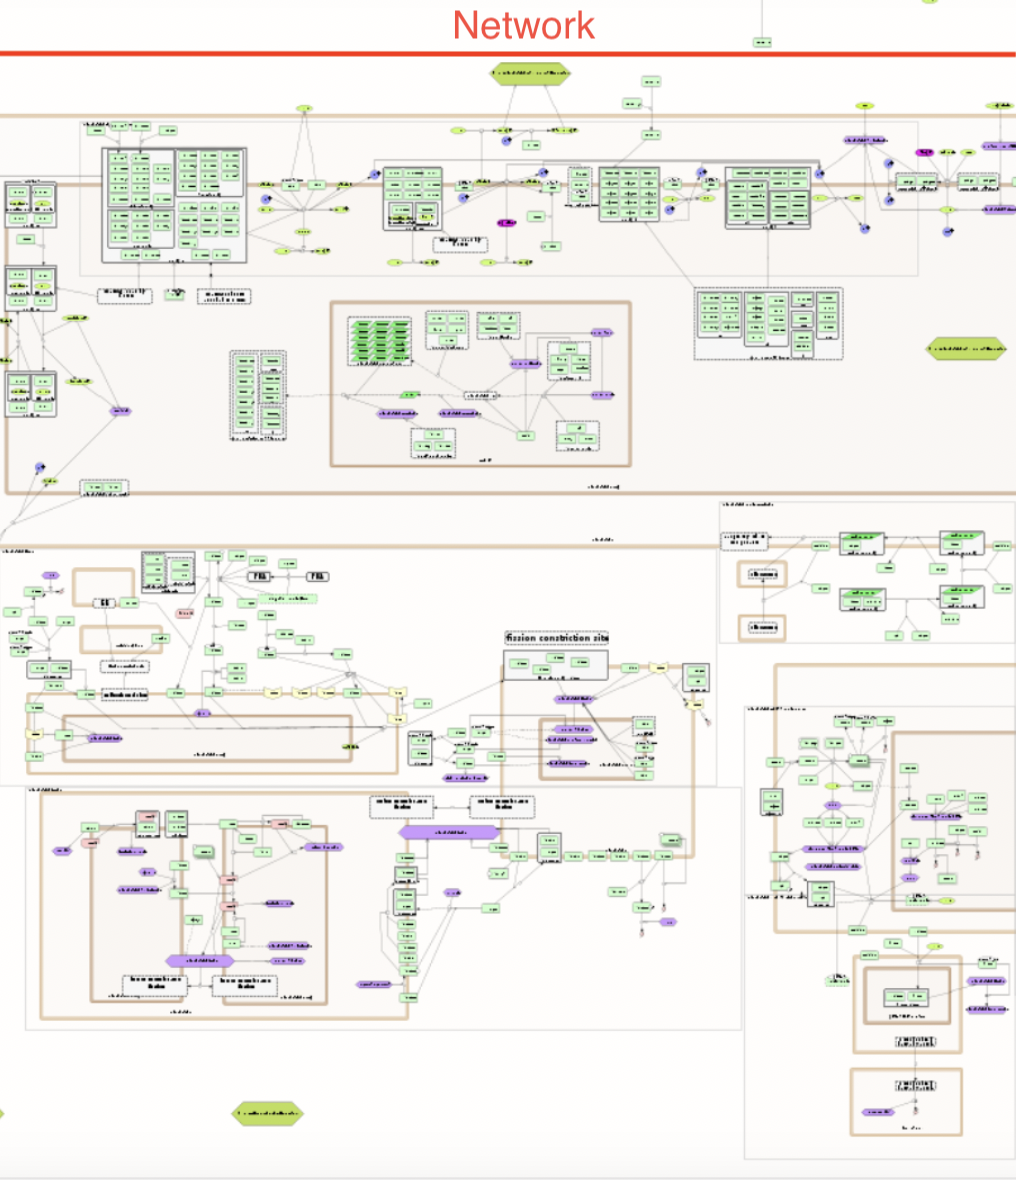
Network displays the structure of map as a colored network.
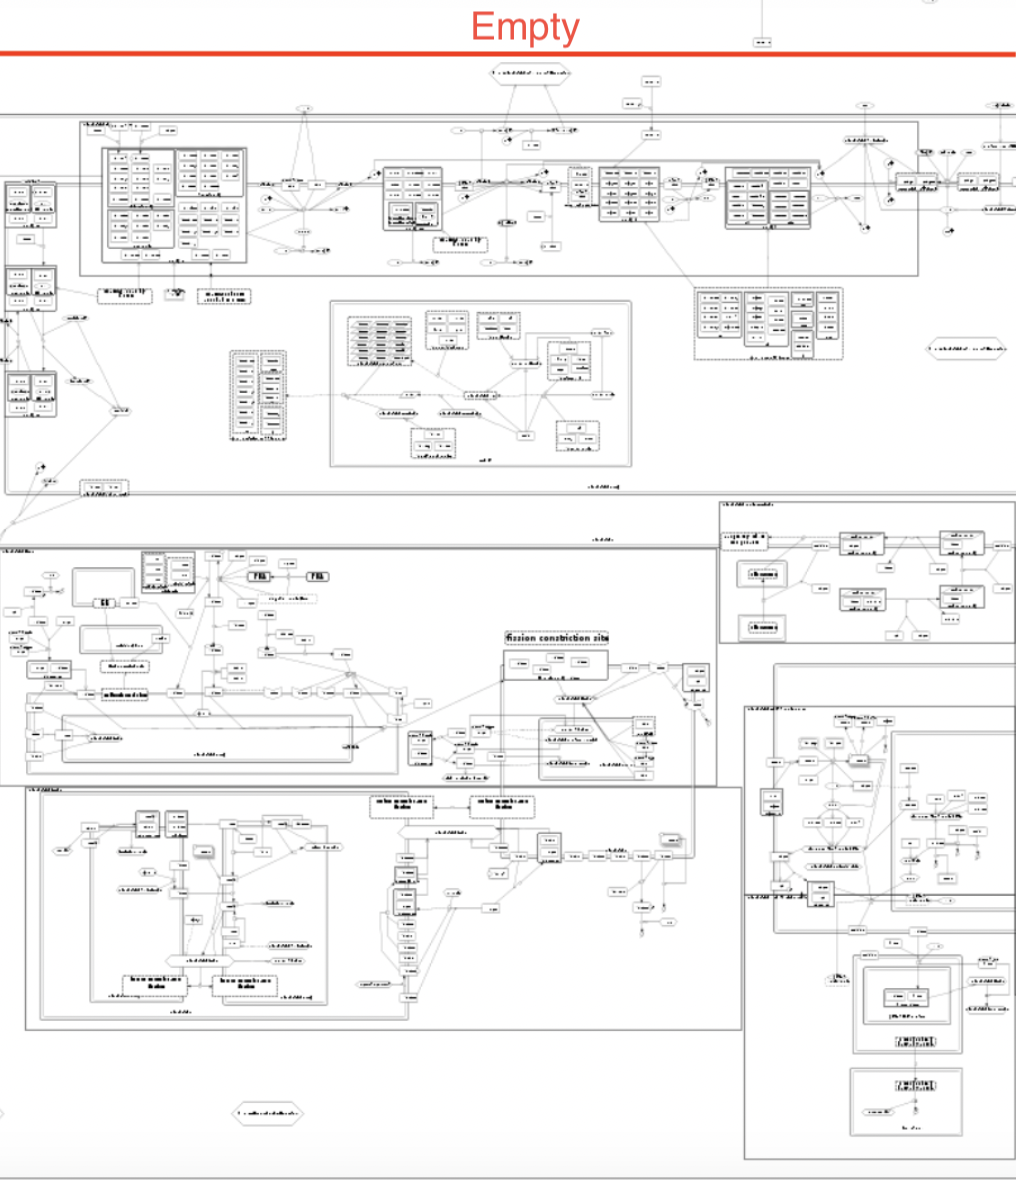
Empty shows only network structure without coloring. This view is recommended for data overlay display.
Browse Overview Images#
This button invokes a static image associated with the displayed content. It may be a graphic that helps to understand the underlying map or any other visual cue chosen by the content curator. The initial image displayed with the Browse Overview Images button can be linked to:
- Another static image to be displayed next
- A defined area in the displayed content
- A set of elements or interactions
Submaps#
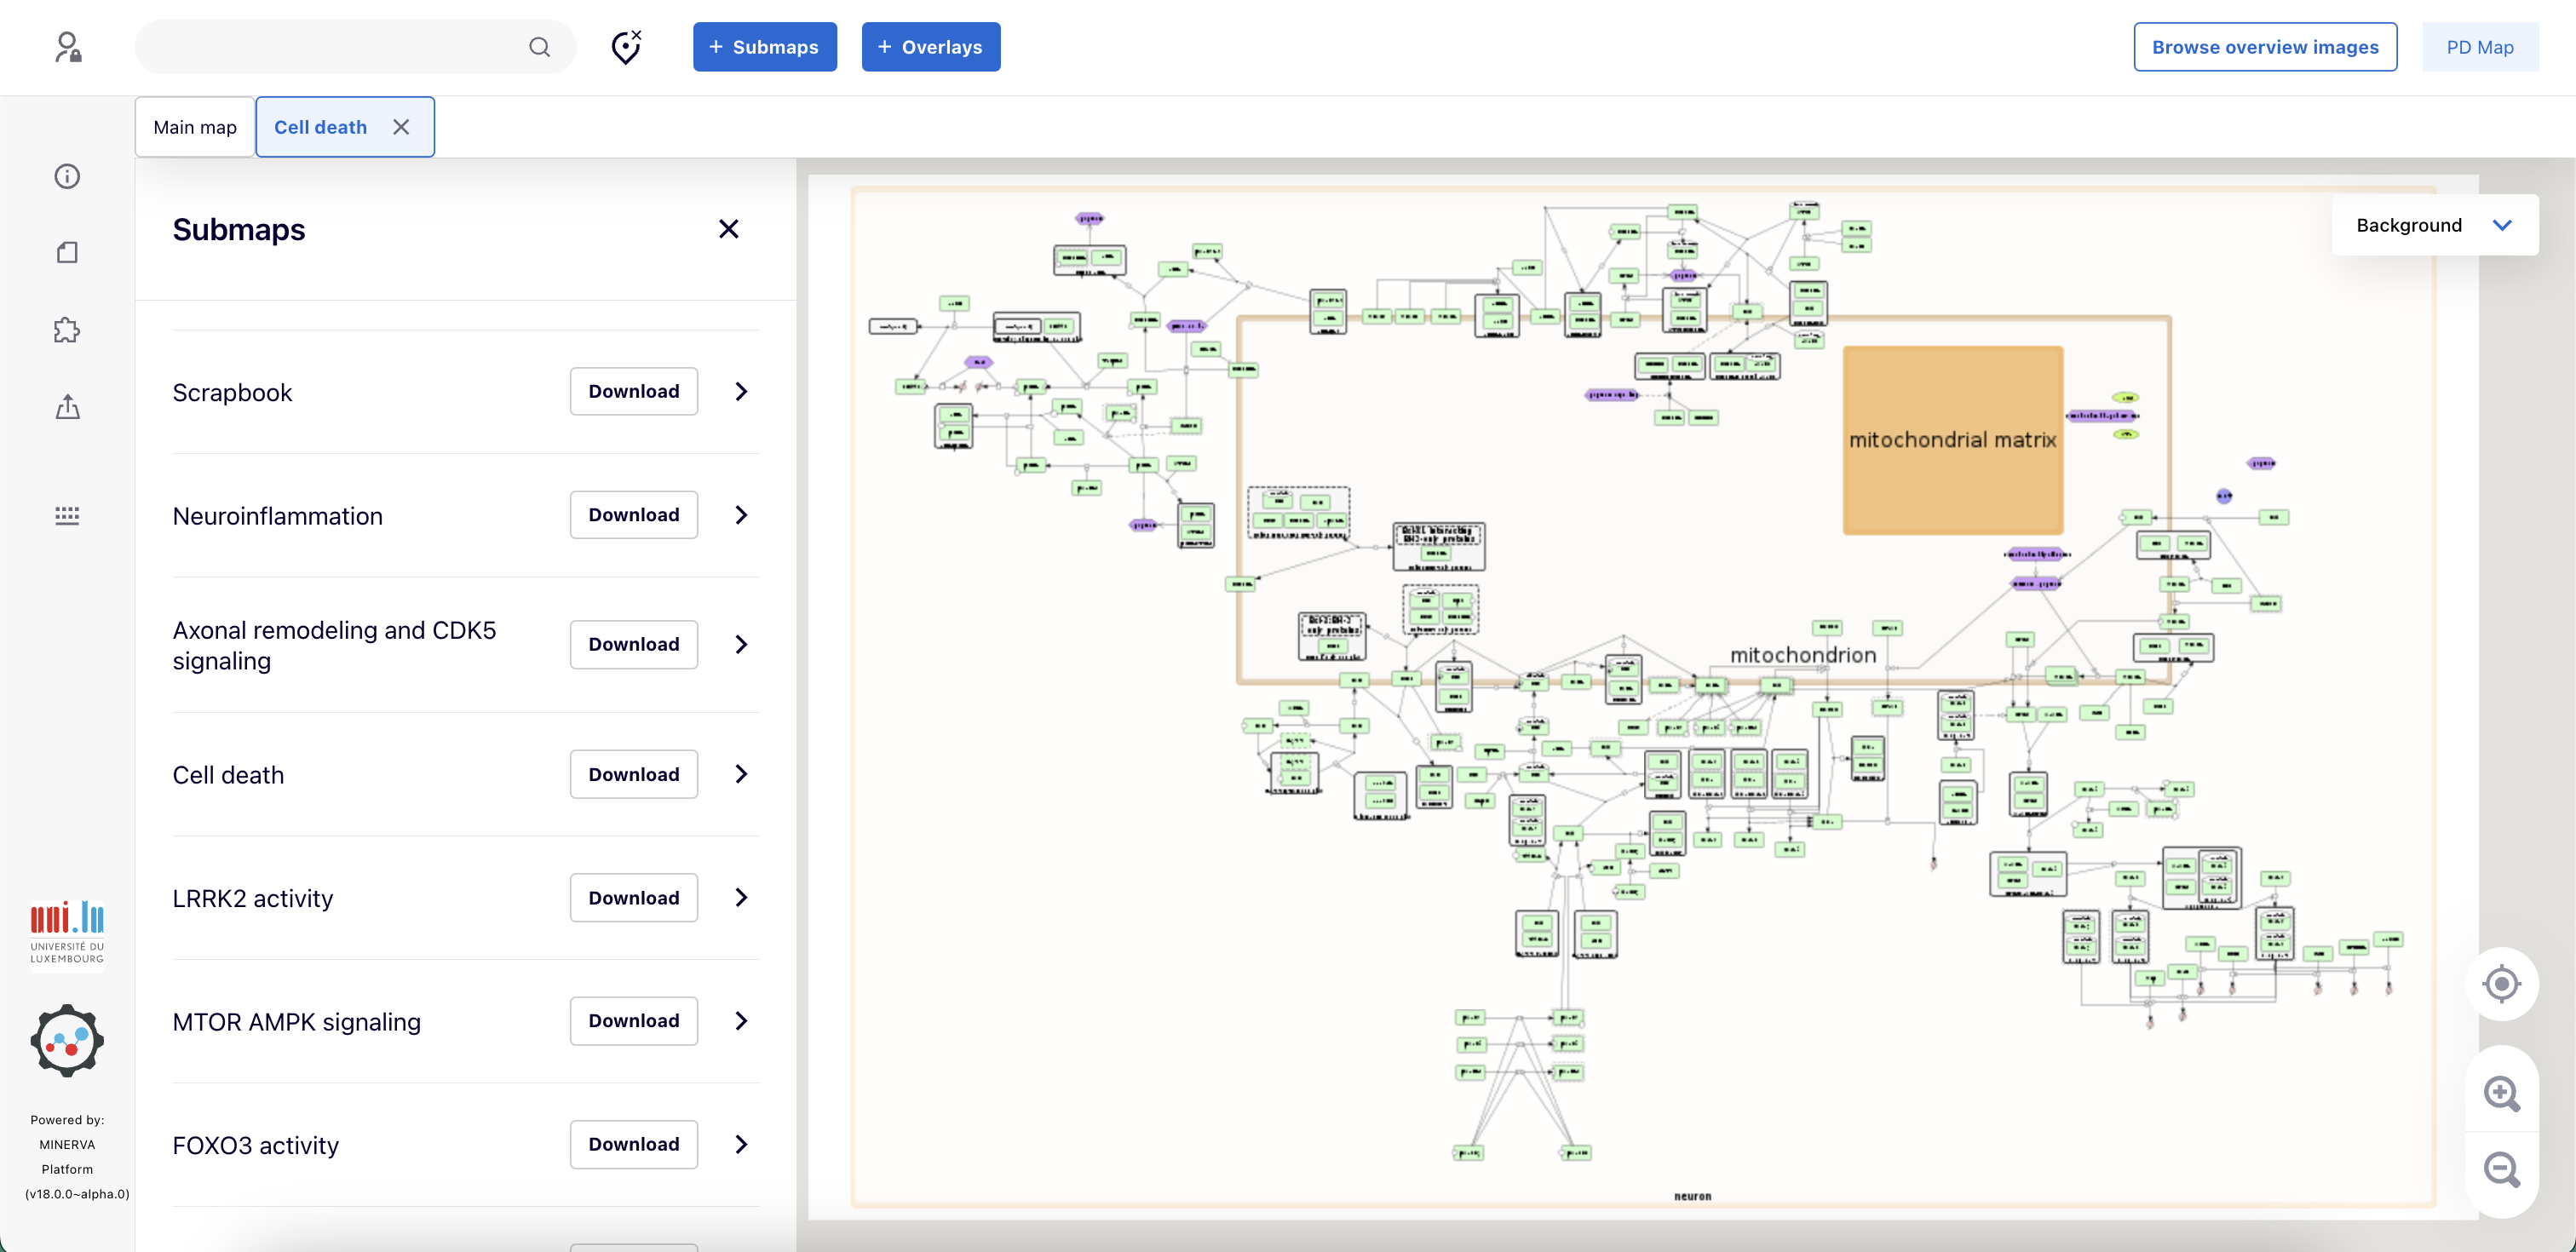
After clicking Submaps button, all the submaps linked to the main map of this project hosted by your MINERVA instance will be shown on the left panel (if the map contains at least one submap). See Administrator manual - advanced upload to learn how to upload the submaps along with the main file.
The shown panel contains
- names of the submaps,
- the right arrow to view the submap,
- a Download button which provides the user this option to download it in GPML, SBML, CellDesigner SBML or SBGN-ML format.
In the image below, you can see the Cell death submap is opened in a new tab and is shown on the display area.
Search is performed in the main map and all submaps, results are grouped by diagram. Similarly, data overlays are shown simultaneously across all diagrams. (red box in image below)