The left panel of the display area is the functional area (see the map). It shows information about selected elements or interactions, allows to query the content, generate custom overlays and browse the submaps.
Search tab#
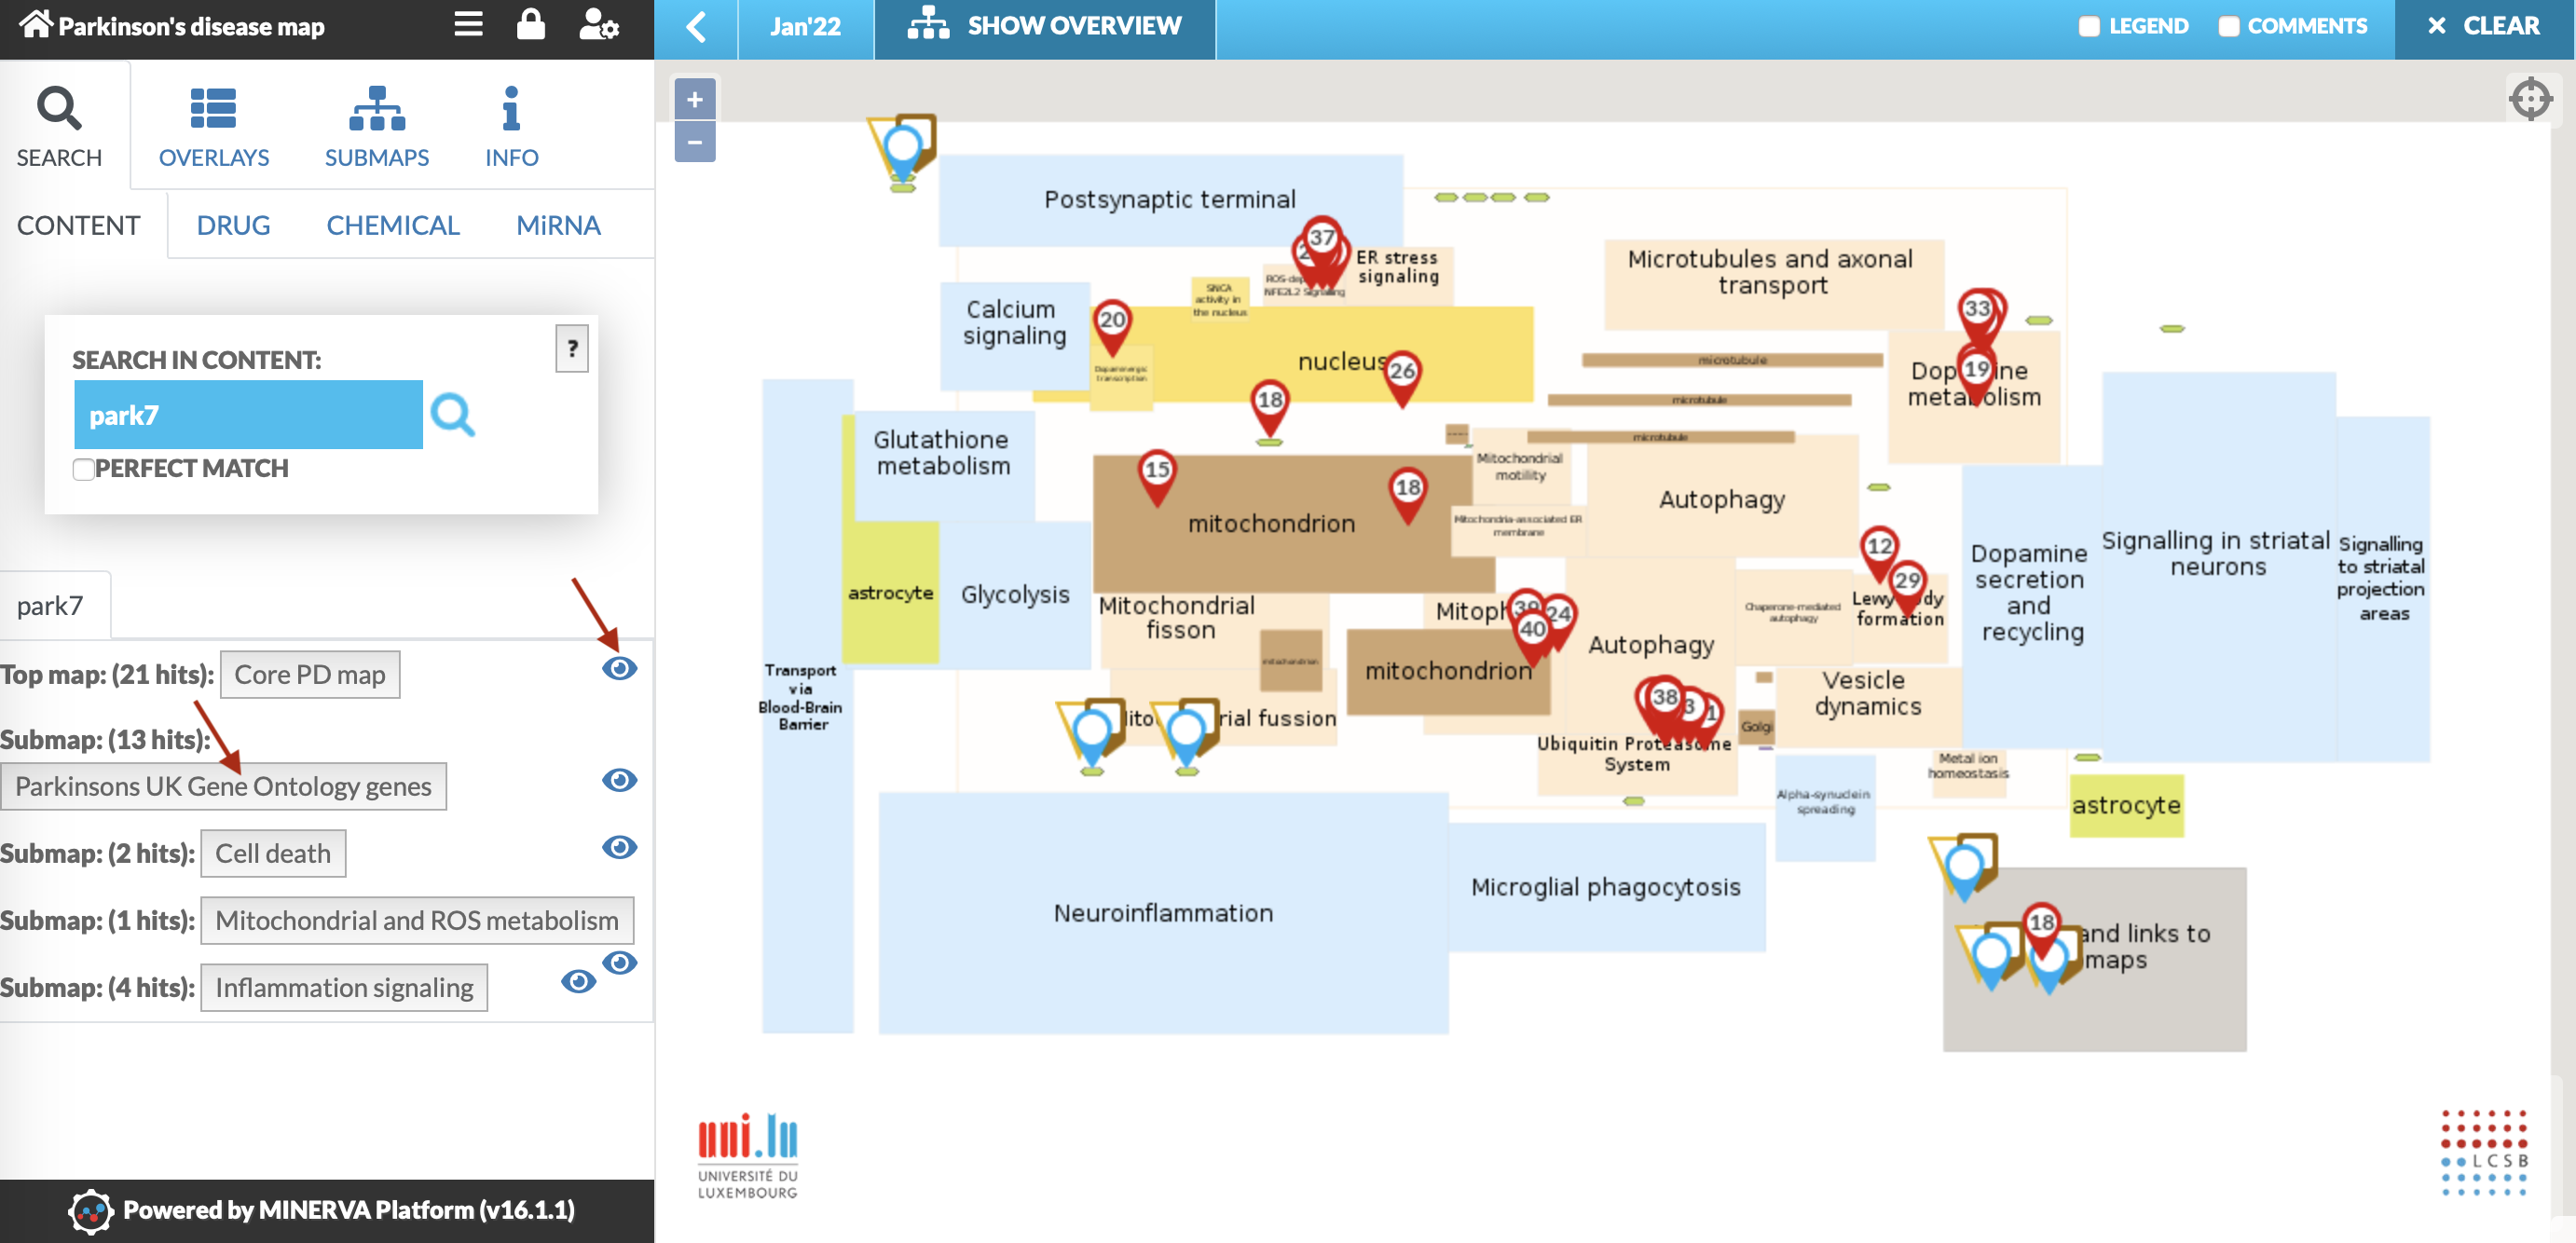
Search tab allows to search for a particular elements or interactions in the displayed map. Similar search results are merged (marked with the same number) and displayed on the map with color pins (see image below). In the left panel the search results are grouped by top map and submaps, with information about size of that group of x elements. Moreover, left panel displays details of each result.
Click on eye icon ![]() reveals detailed information on selected elements or interactions, such as: element’s compartment and full name, symbols, annotations and their source (automatic or manual by curator).
reveals detailed information on selected elements or interactions, such as: element’s compartment and full name, symbols, annotations and their source (automatic or manual by curator).
Click on the submap name opens the submap with the search results pins displayed.
There are four subtabs available in the Search tab, offering different scopes:
- CONTENT for regular search
- DRUG for drug target search
- CHEMICAL for chemical target search
- MiRNA for miRNA target search
Content search#
Here you can search through the map content by simply typing in the element’s e.g. park7, water. Search will look for similar names and synonyms of the elements in the map, and display the results.
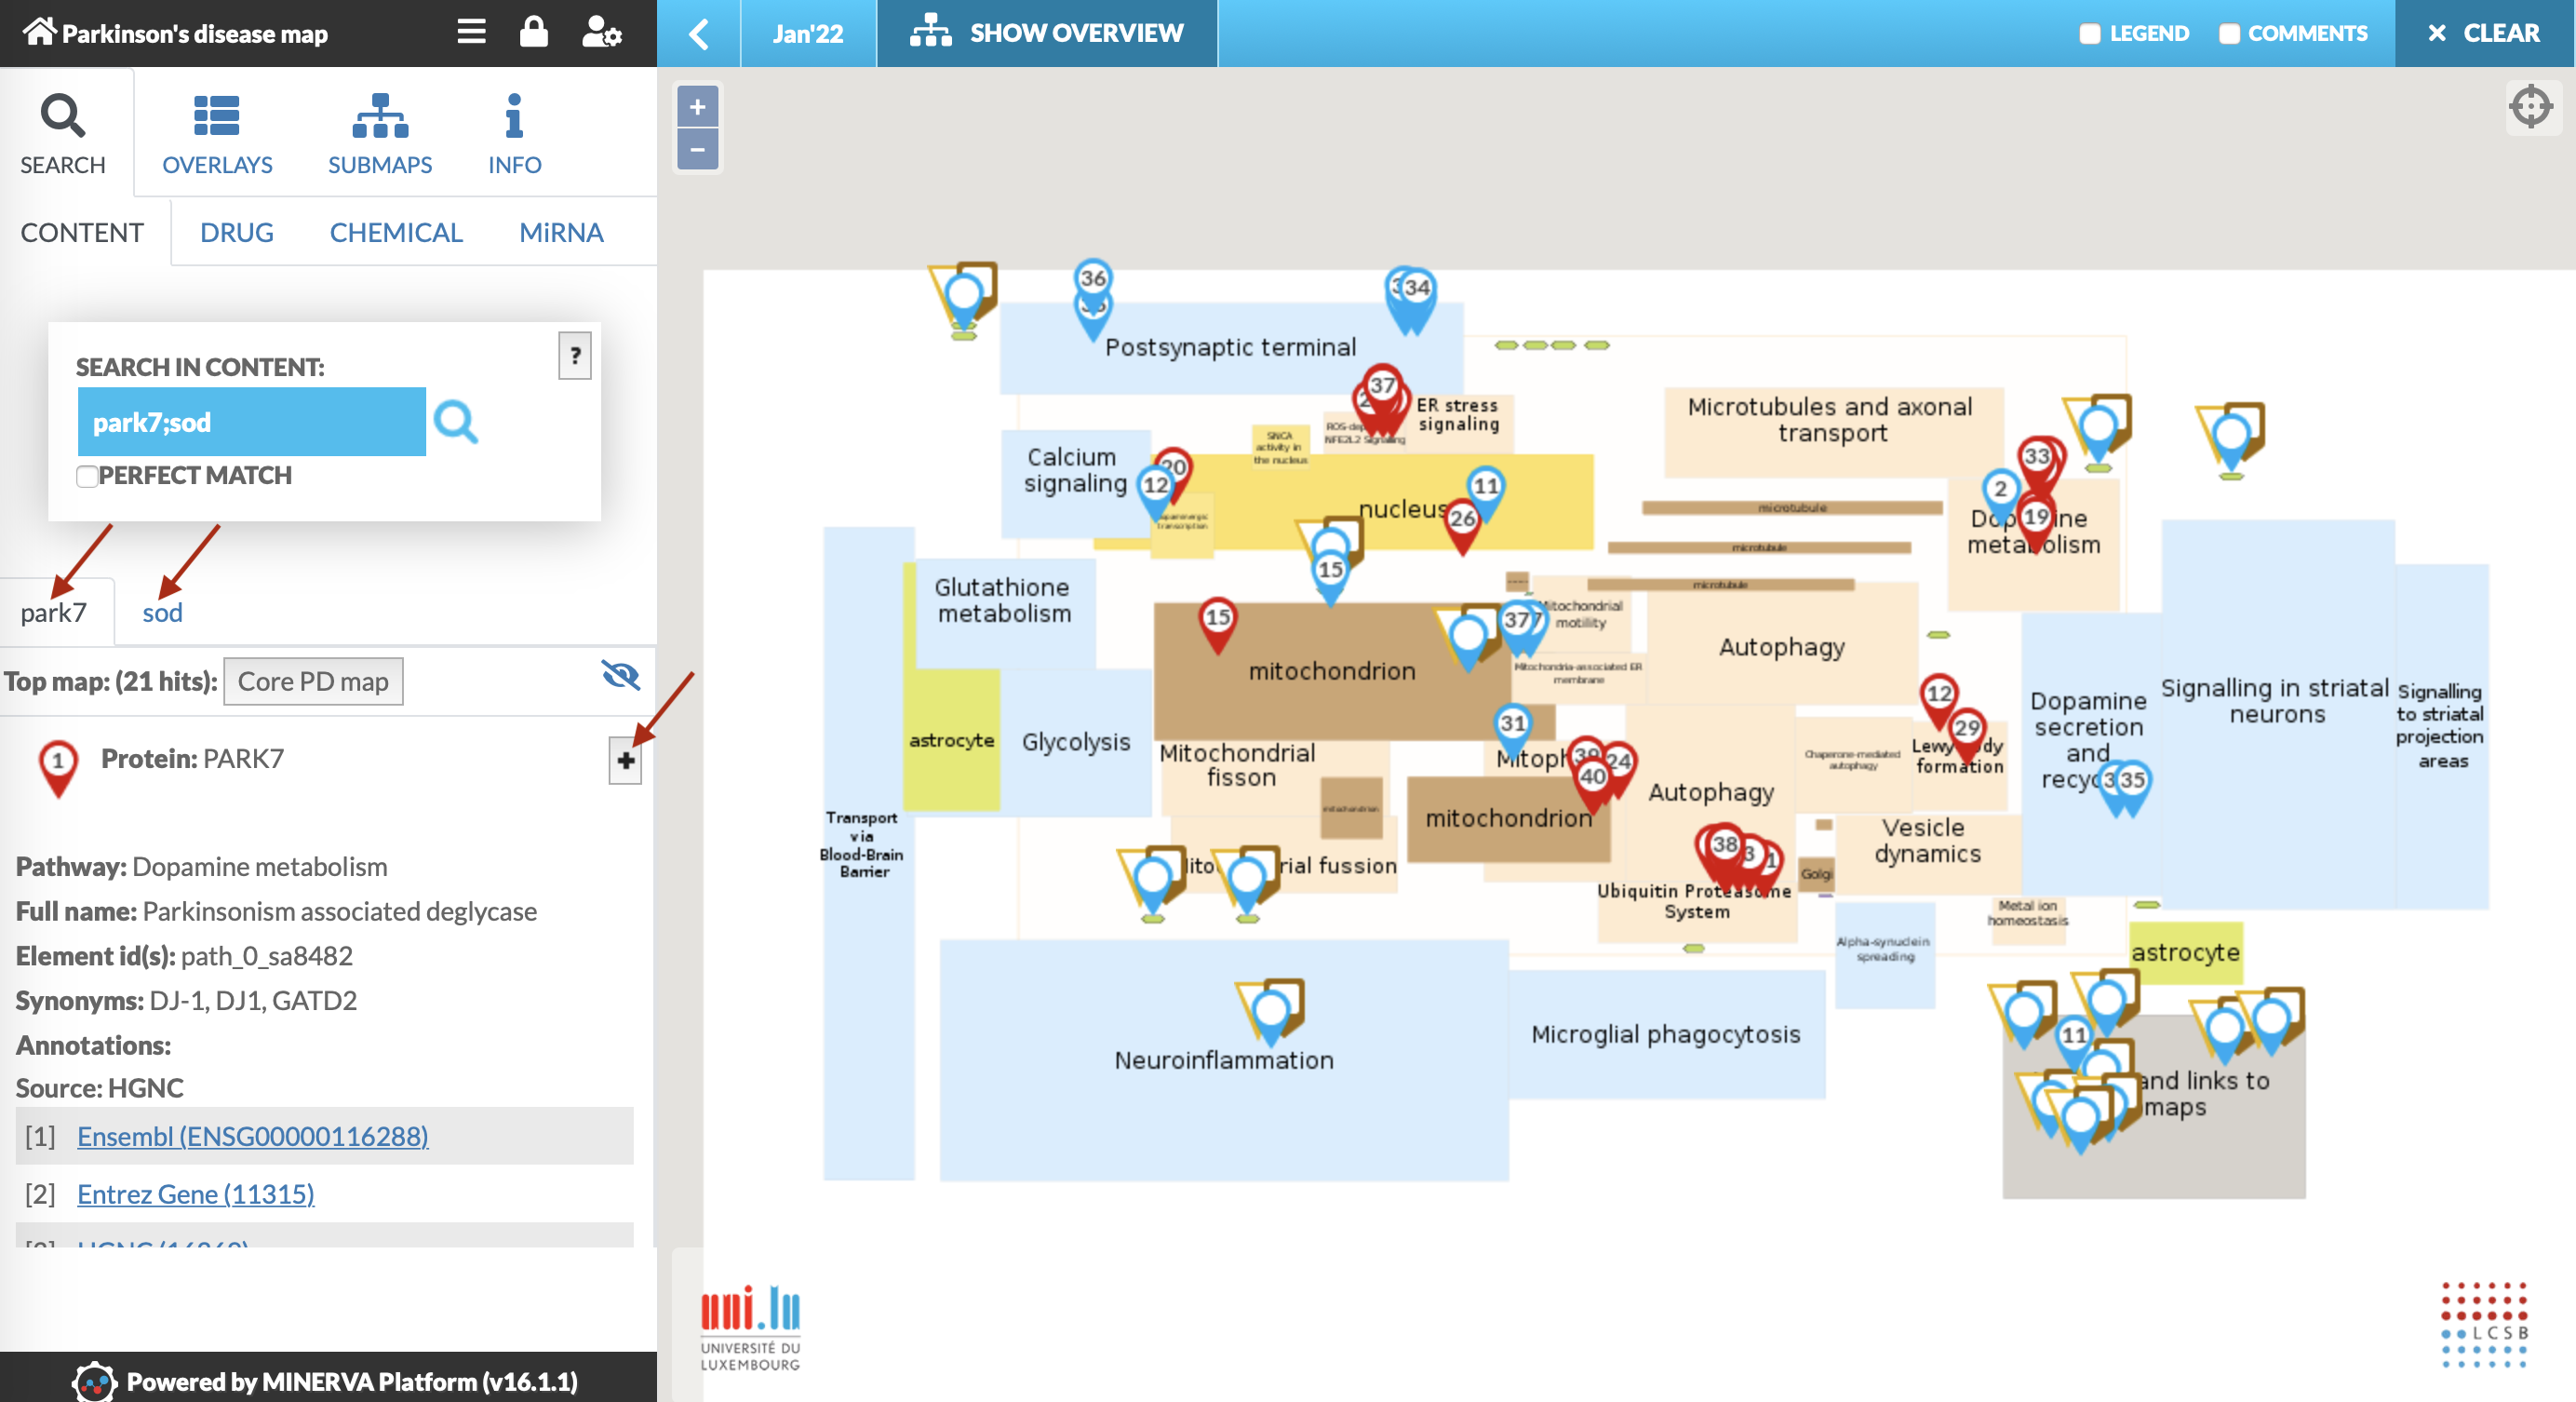
- Multiple search
If you search for more than one element separate the queries with a semicolon ‘;’ (e.g.
park7; sod). Search results for separate terms will be visible in separate tabs, and the pins on the map will have different colors (image below). The button shows/hides particular information as per Search panel options setting in MINERVA configuration.
When multiple search returns common targets these are highlighted with a special icon
button shows/hides particular information as per Search panel options setting in MINERVA configuration.
When multiple search returns common targets these are highlighted with a special icon  .
The same icon indicates search results that are found in a submap, see more in Submaps.
.
The same icon indicates search results that are found in a submap, see more in Submaps.
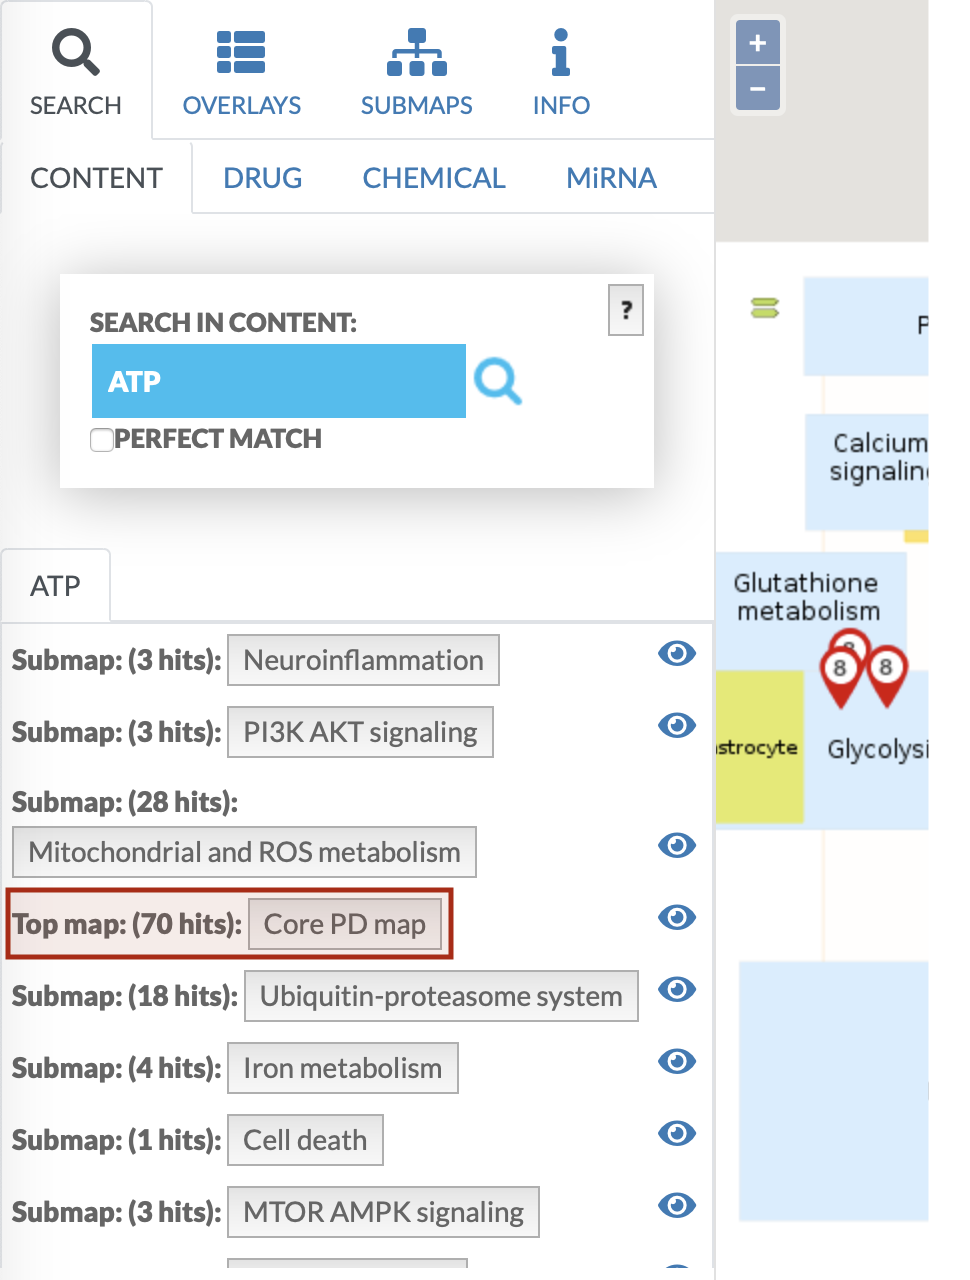
Identifier search You can search directly for an identifier of element. The query looks like
annotator's name:identifiere.g. hgnc:14581.Find reaction You can also search for an identifier of a reaction (visible in the left panel after clicking on a particular reaction). To do this, you need to add
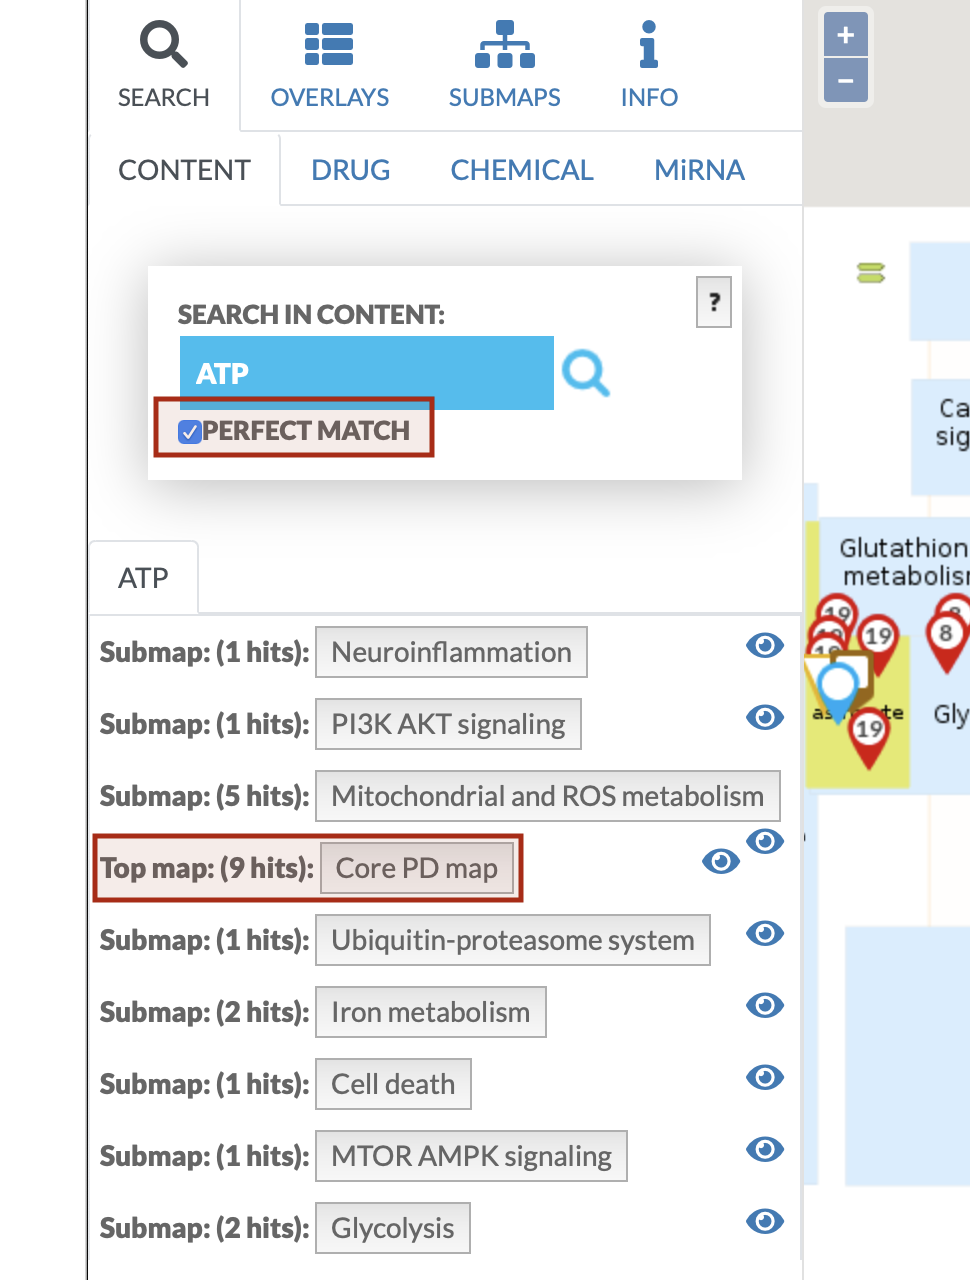
reaction:prefix to the searched term, e.g. for a reaction with id re944 you will search for a term reaction:re944.Perfect match If this box is ticked, only terms exactly matching the query will be returned. For large networks or broad queries the search results may be capped to ensure the performance of the system. The limit of displaying search results can be configured by the administrator (see configuration).
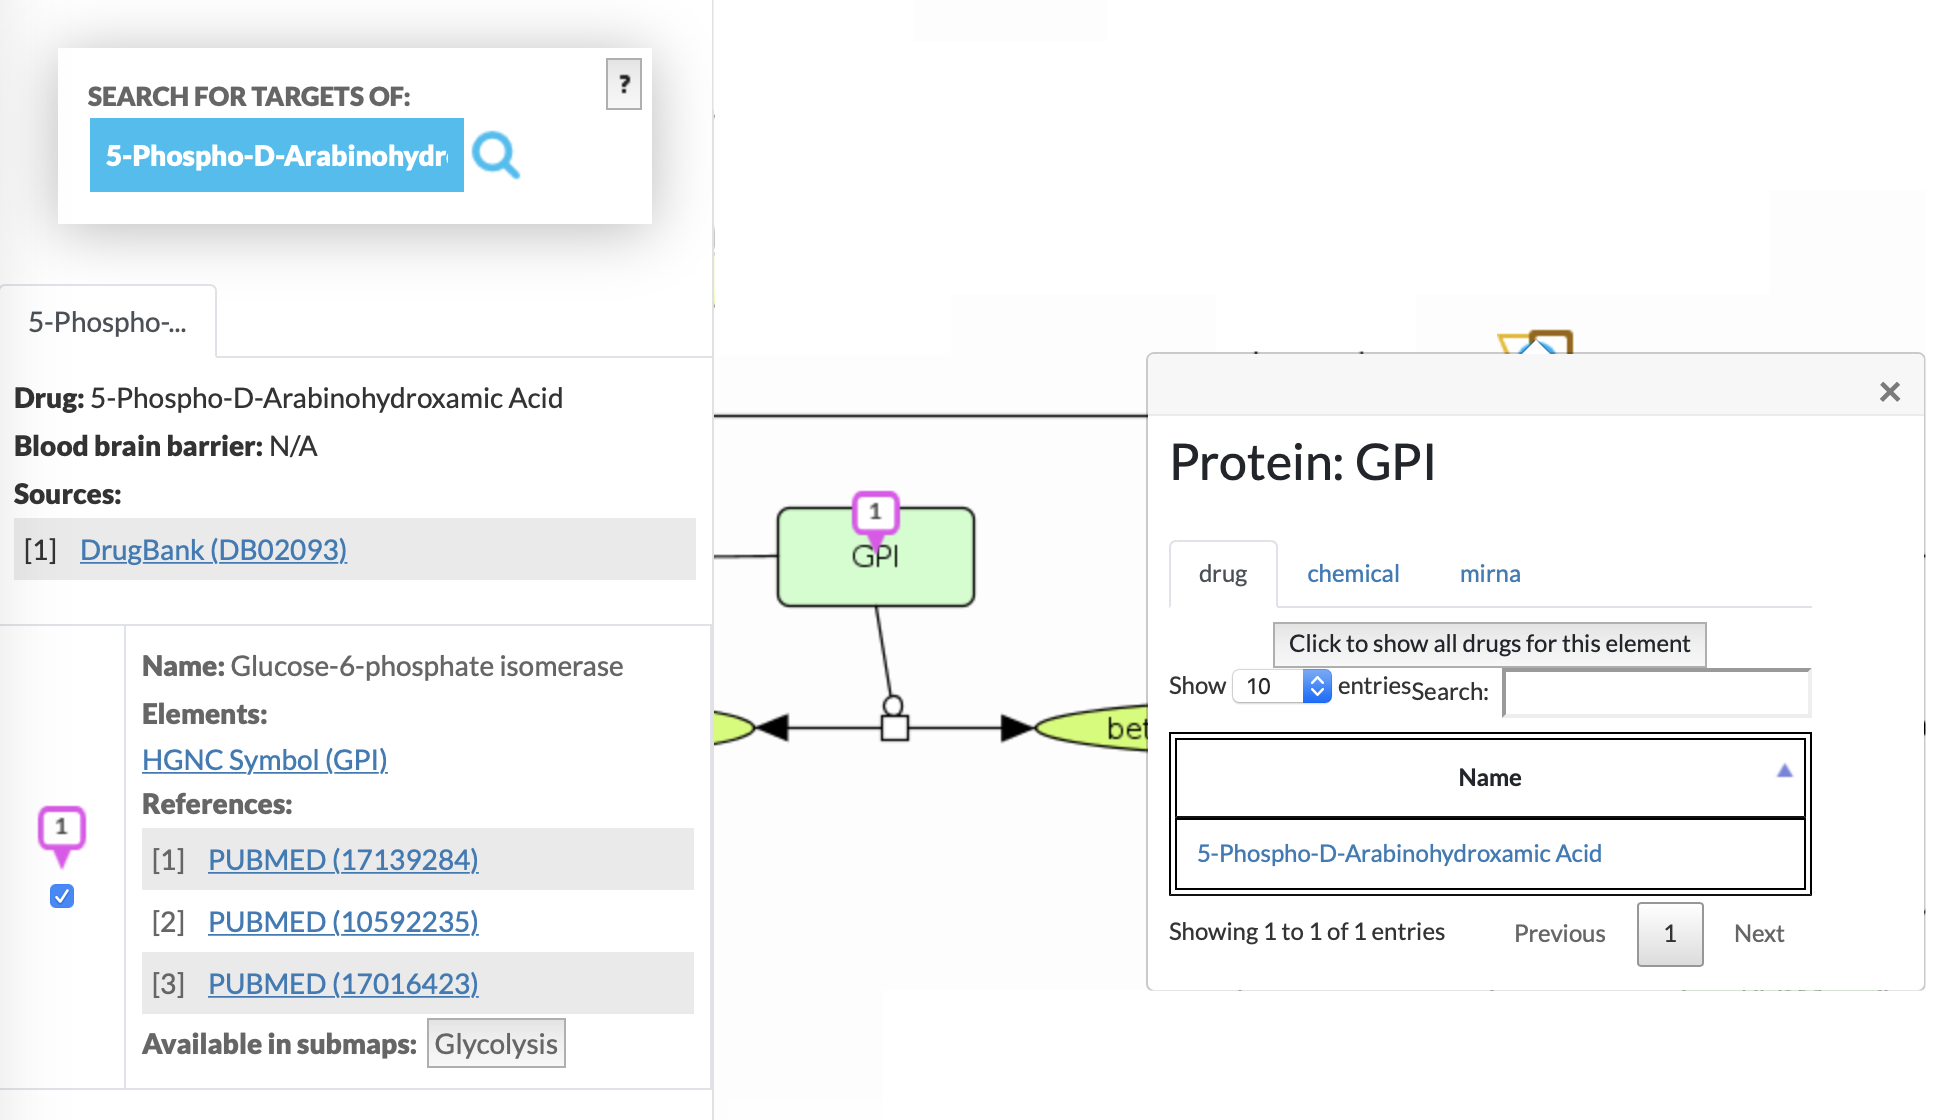
“Reversed” search Click on the pin to display the element’s popup, which allows to view drugs, chemicals or miRNA interacting with the protein. Button
Click to show all drugs for this element(image below) search for the interacting elements and list them, see image below on the right.
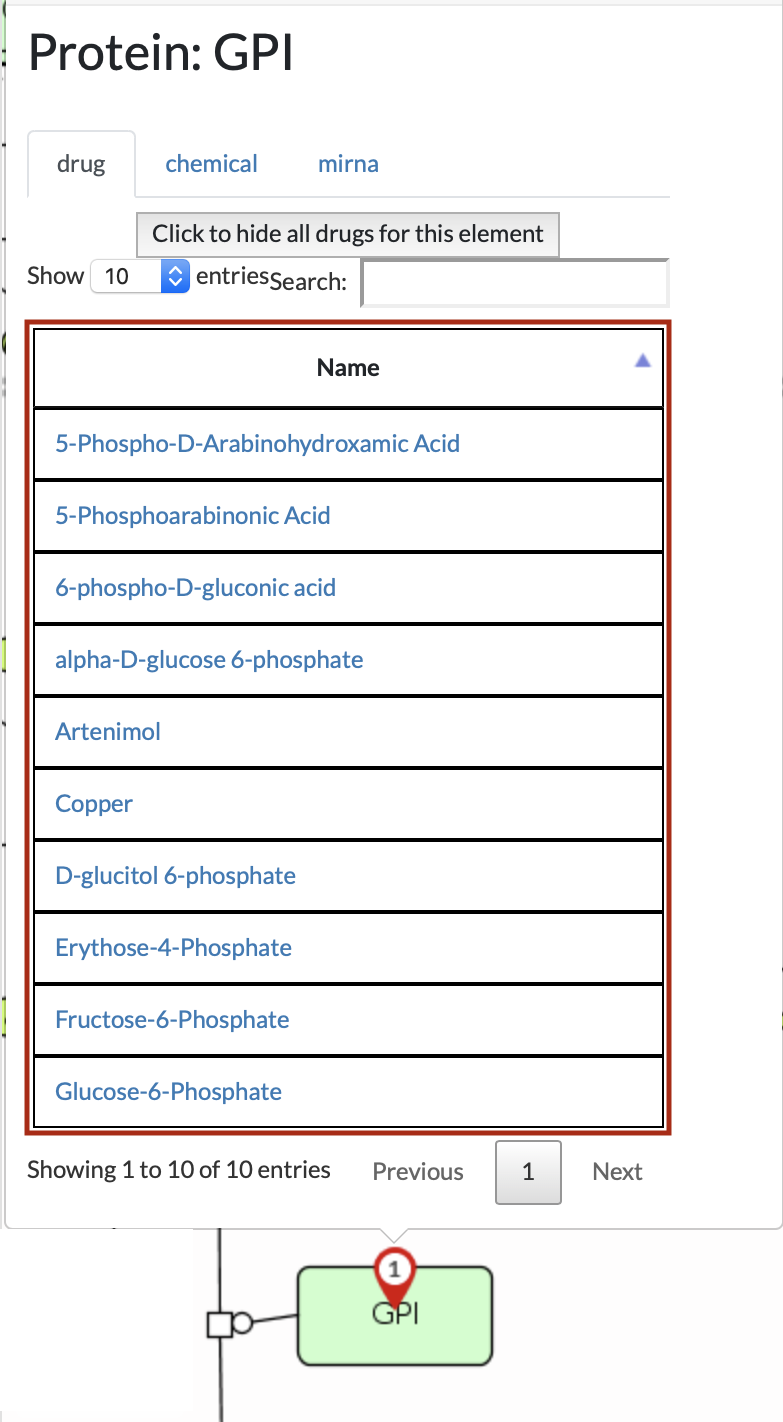
Click on any of the “reversed” search results - its details will be displayed in the left panel, image below. Note that search results of drugs have different shape of pin than regular search results pin.
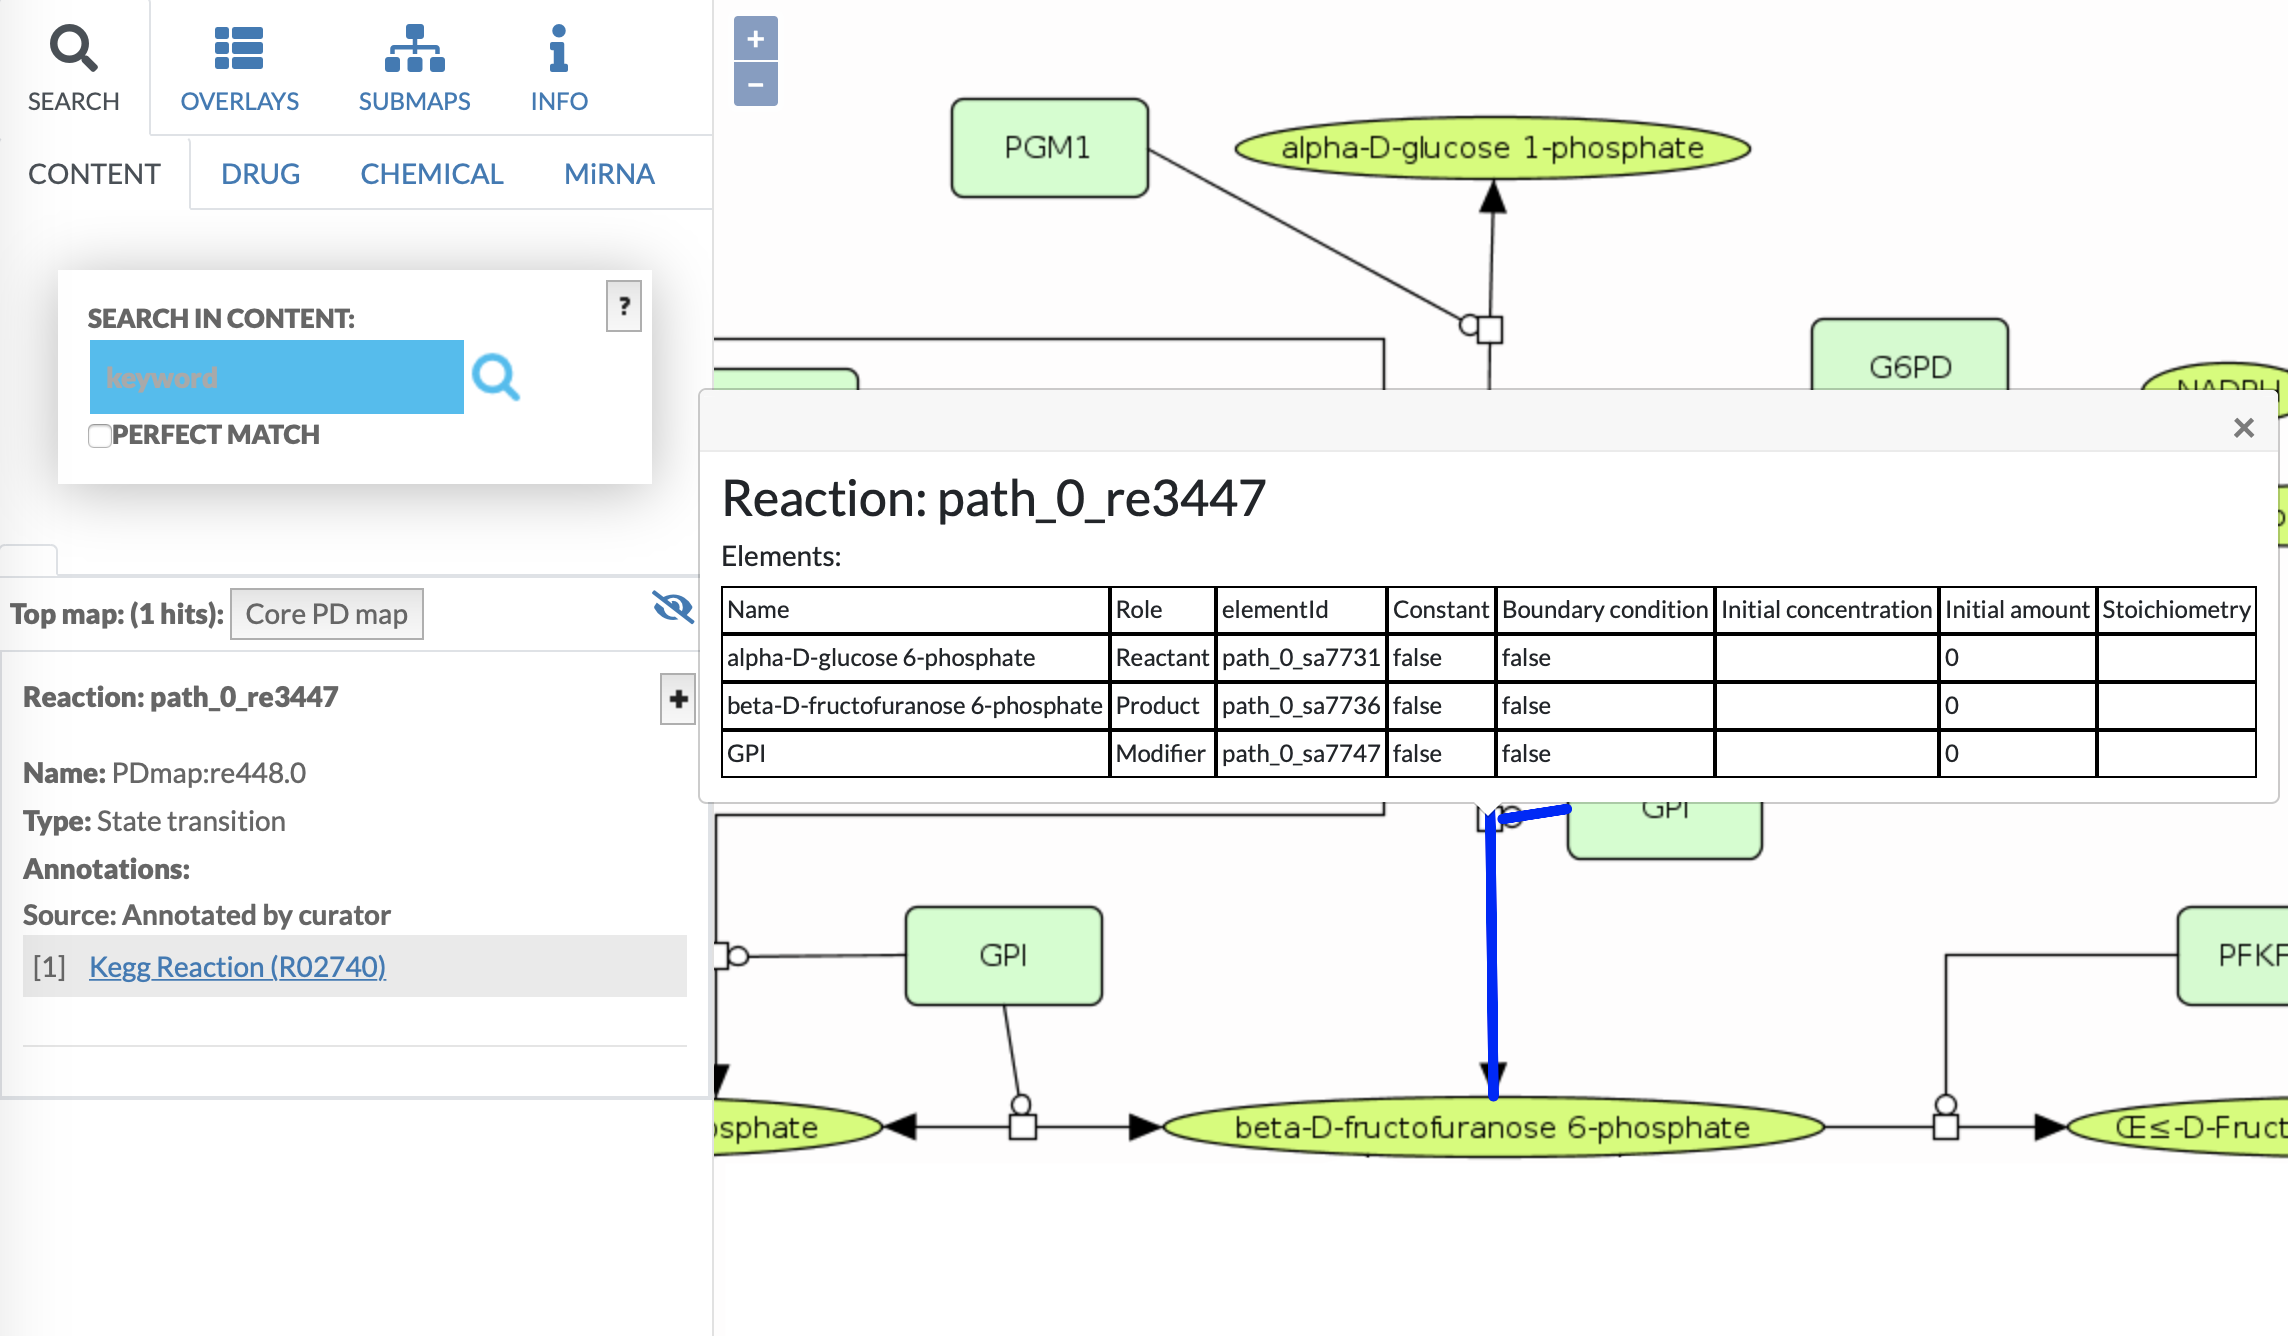
- Reaction kinetics Click on any reaction to highlight it. In the left panel you will find details of the reactants.
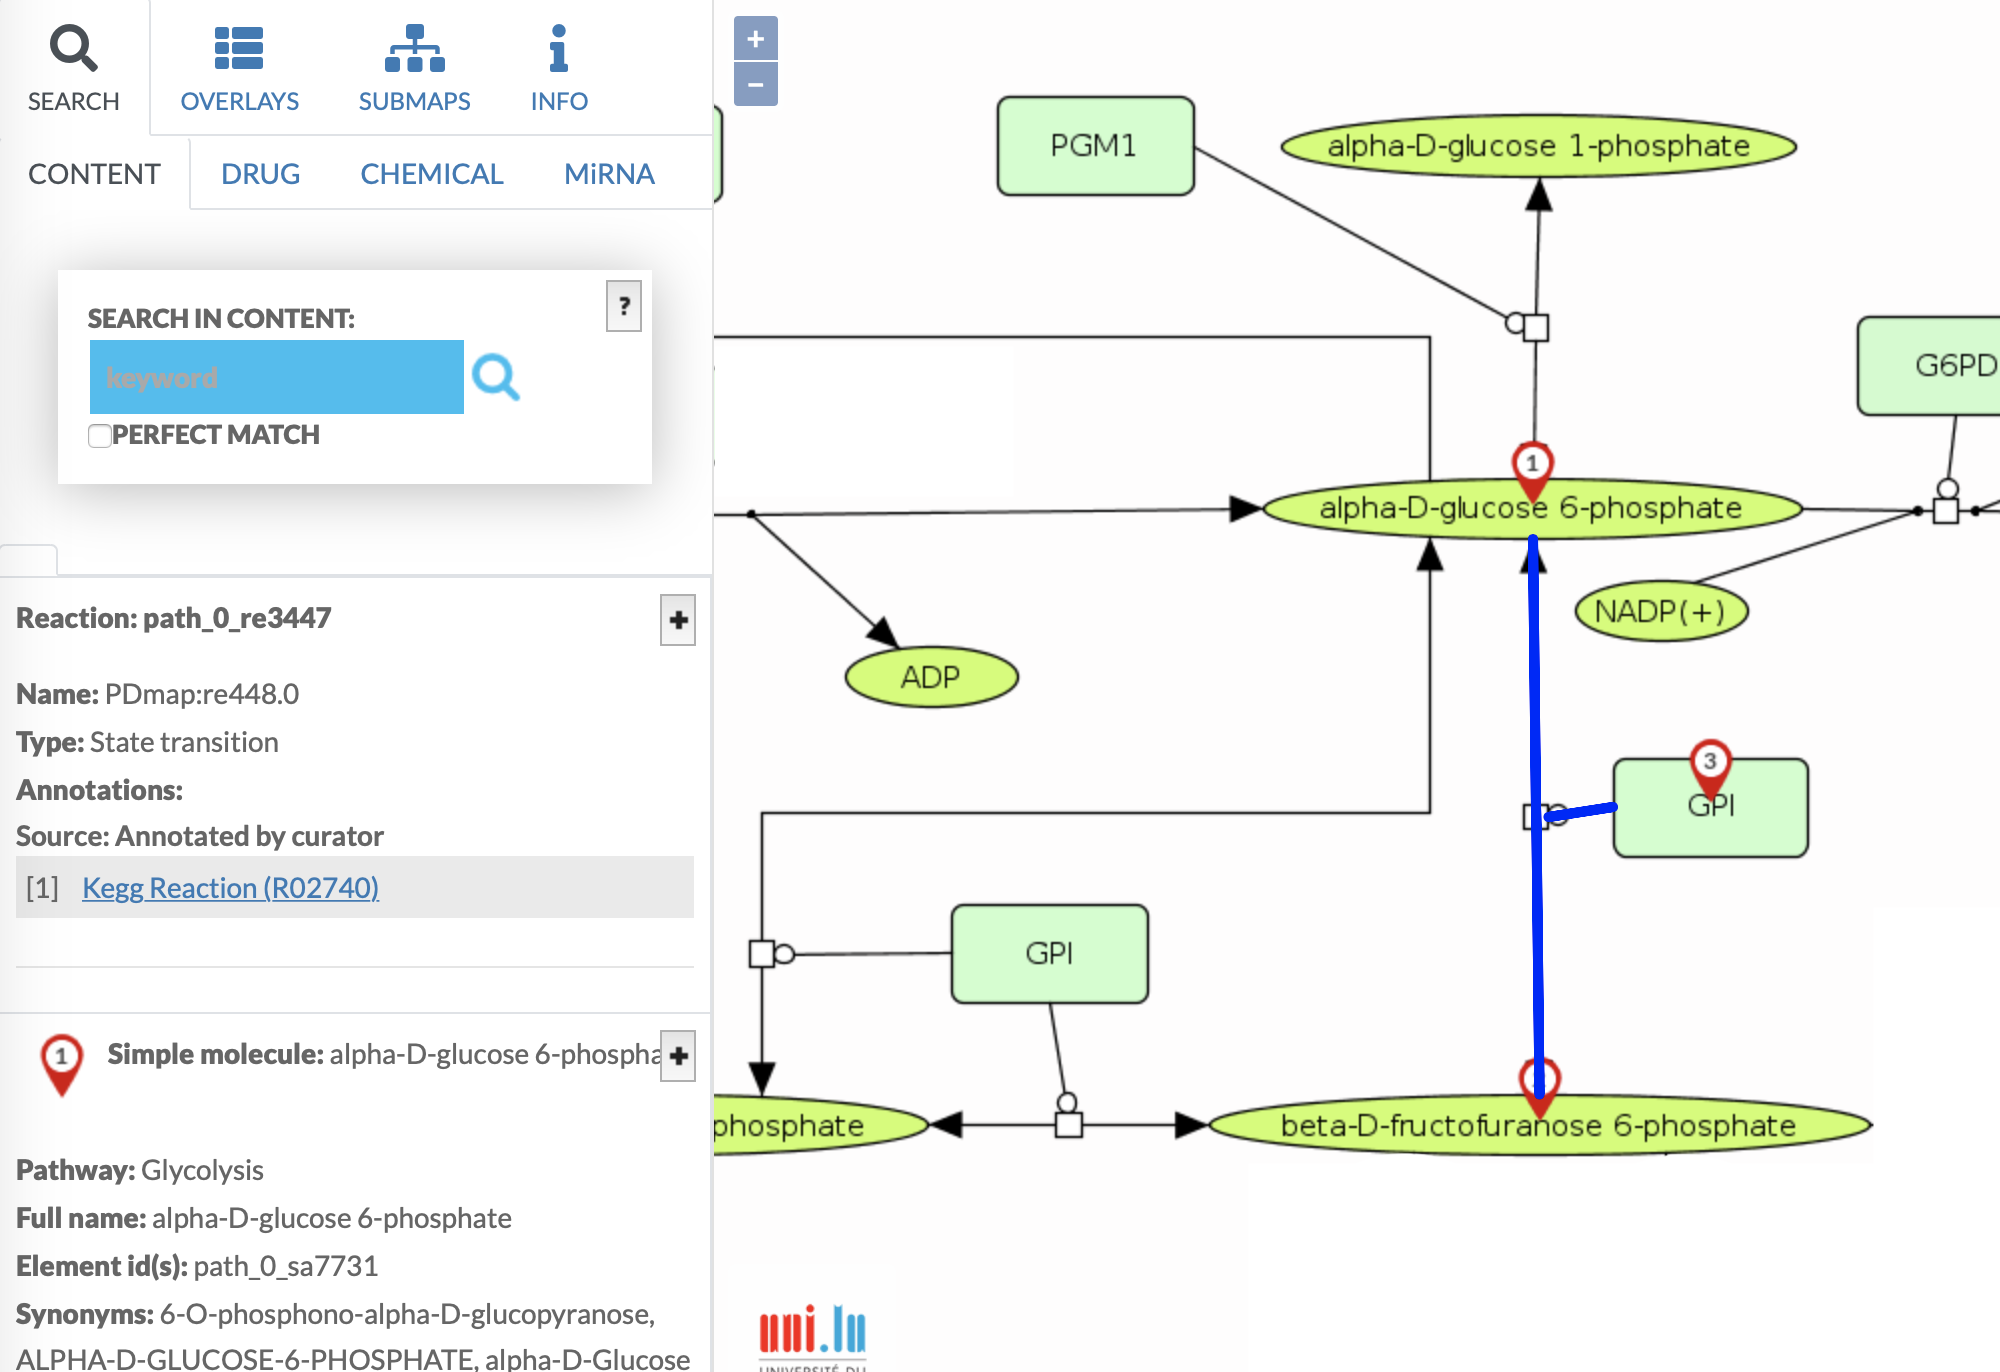
The reaction kinetics, if available, is displayed in the popup dialog after clicking on highlighted reaction.
Direct link search Direct link to the elements in the display area is possible, as the search query can be provided within the web address of the displayed project. An address has to be manually constructed, directly into web browser, as below:
your.webserver.address/?search='search query'is a link executing the search for a given search query in the default project of your MINERVA instance. For example, an address
your.webserver.address/?search=reaction:xyz123will directly point to an interaction with id xyz123. Referring to a given project on your MINERVA instance requires additionally to pass the project identifier in the address, as shown below. Identifiers of projects are accessible using the Admin view.
your.webserver.address/?id='project id'&search='search query'
Drug (target) search#
The Drug scope works as follows: Drug subtab under the Search tab allows to look for known drugs or their brand names and display their targets in the map. The pins have specific shape ![]() , different than the results of other search scopes.
, different than the results of other search scopes.
- Search field: type your search query here, separating multiple drug names or their brand names with a semicolon ‘;’. DrugBank (click) and ChEMBL (click) will be queried for known targets to be displayed in the map.
- Drug description, synonyms and all known targets will be displayed in the left panel.
Chemical (target) search#
The Chemical scope works as follows: Chemical subtab under the Search tab allows to look for known chemicals or their synonyms and display their targets in the map. The pins have specific shape ![]() , different than the results of other search scopes.
, different than the results of other search scopes.
- Search field: type your search query here, separating multiple chemical names or their synonyms with a semicolon ‘;’. Clinical Toxicogenomics Database (click) will be queried for known targets to be displayed in the map.
- Chemical description, synonyms and all known targets will be displayed in the left panel.
miRNA (target) search#
The microRNA scope works as follows: MiRNA subtab under the Search tab allows to look for miRNAs and display their targets in the map. The pins have specific shape ![]() , different than the results of other search scopes.
, different than the results of other search scopes.
- Search field: type your search query here, separating multiple miRNAs with a semicolon ‘;’. miRTarBase (click) will be queried for known targets to be displayed in the map. Use only mature sequence IDs according to miRBase (click), e.g. hsa-miR-125a-3p.
- Known targets will be displayed in the left panel.
Clear button#
The clear button, located at the top-right corner of the user view, clears all search results currently shown in the display area.
Overlays tab#
Overlays tab allows to display or generate custom coloring of elements and interactions in the map. It is composed of three sections, image below:
- backgrounds,
- general overlays,
- user-provided overlays (which becomes visible upon login).
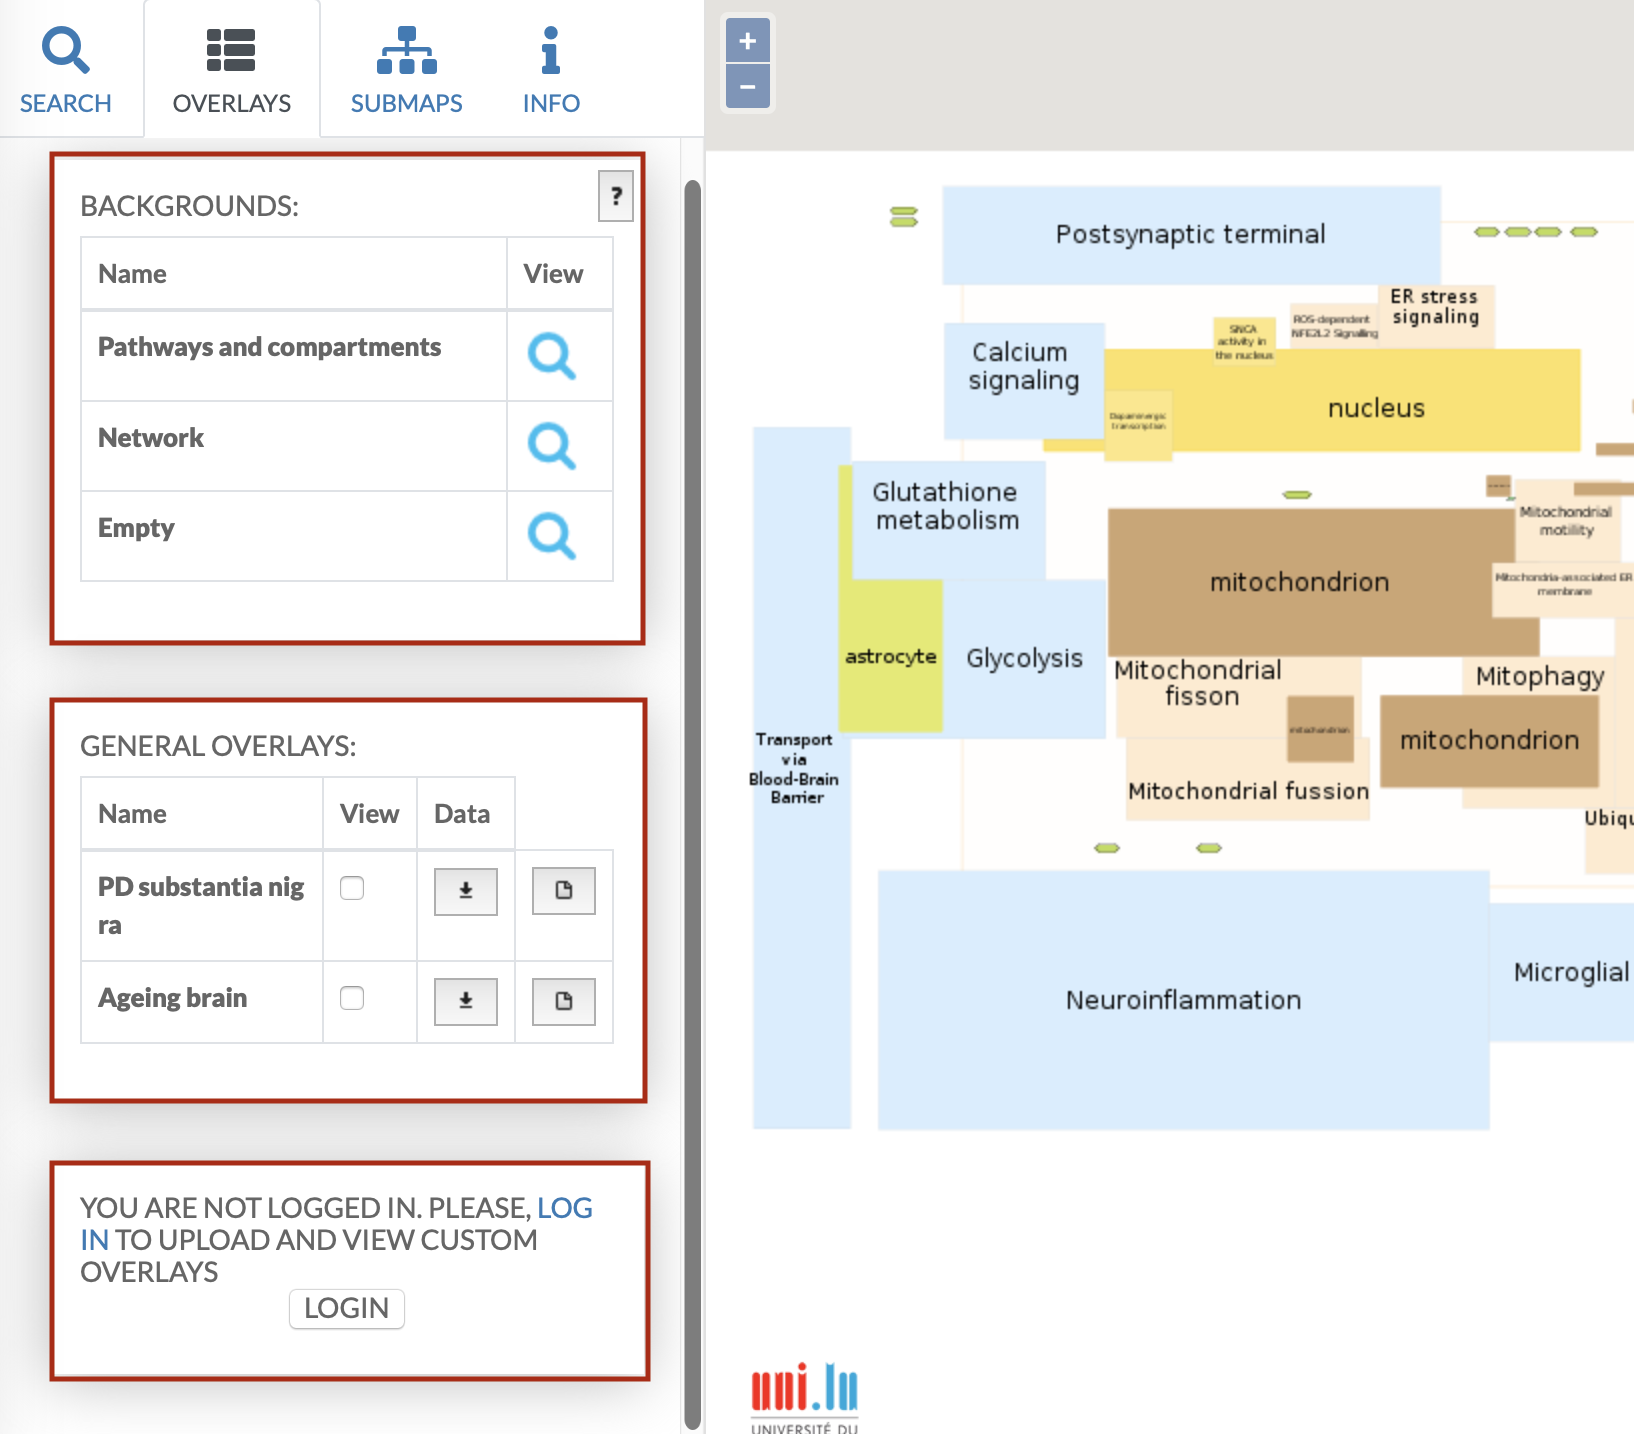
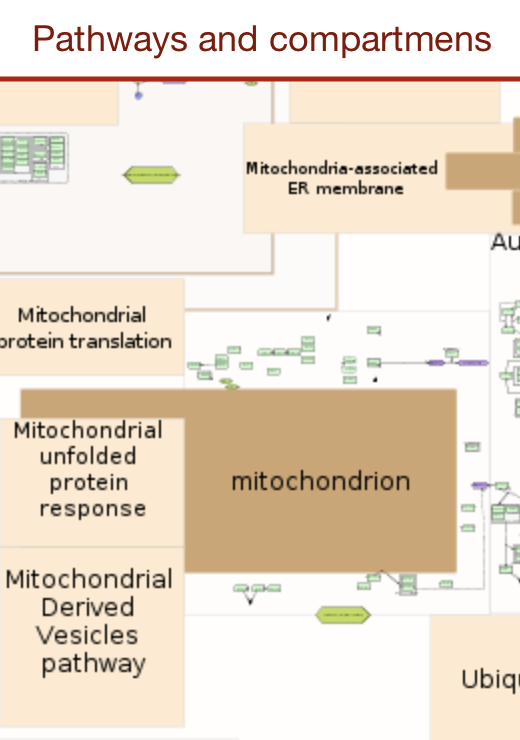
Backgrounds#
Pathway and compartments is default background for the maps. Main feature of this view is Semantic zoom which improves map’s clarity. In this particular view, on the high level of zoom bigger areas overlay smaller ones, and the contents of complexes are masked.
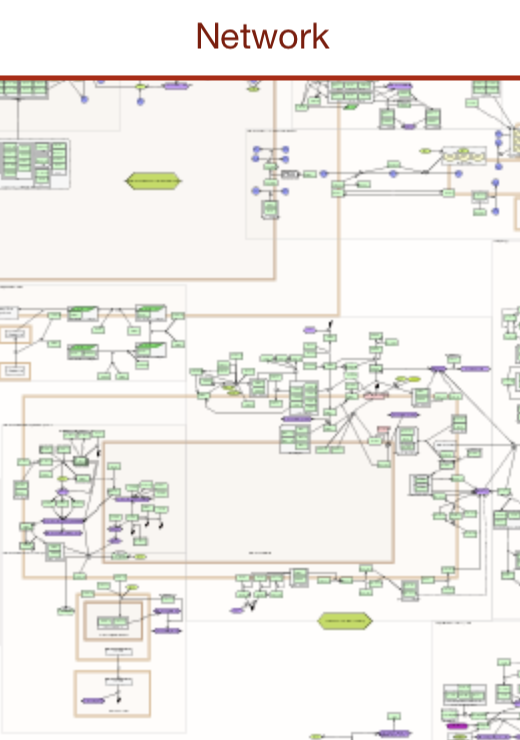
Network displays colored network structure.
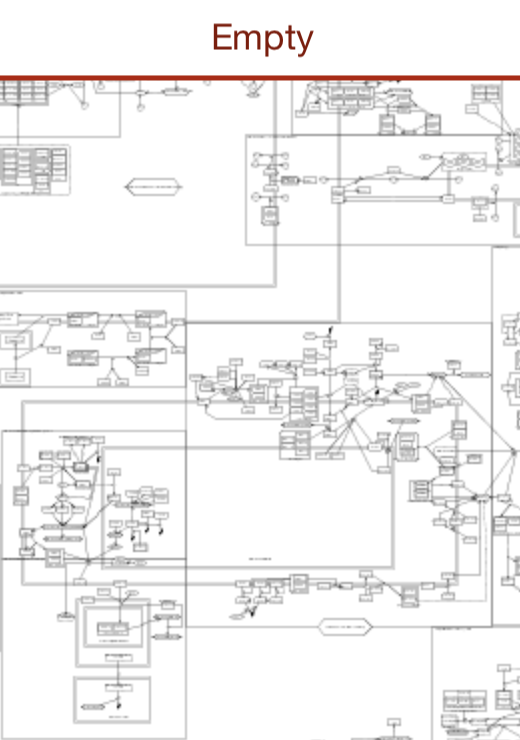
Empty shows only network structure, no coloring. It is recommended for data display.
General and user-provided overlays#
Data overlays provide additional information about elements and interactions. Data overlays can be general or user-provided:
General overlays are accessible for every user viewing the content.
User-provided overlays are your private overlays, uploaded and available only for you.
Also, there are two types of data overlays (more details in the next section):
Generic overlay displays a coloring on the map according to data set of indicated molecules (e.g. differentially expressed genes).
Genetic variant overlay displays a coloring for the genes, for which the variants are present. It also enables the genome browser popup, displaying the position of a variant in the sequence of the corresponding gene.
In the left panel there are following feature for overlays:
View the overlay - tick the chosen boxes to display multiple overlays - choosing that option automatically turns the background to Empty to emphasize the overlay’s colors. Also, in the bottom left corner the legend for each overlay will be displayed.
Data column contains buttons, where applicable, allowing to download the dataset used to generate the overlay.
Edit - change name, description or remove overlay.
Description display - hover over the overlay name/view to display a short description of the dataset, if provided on upload.
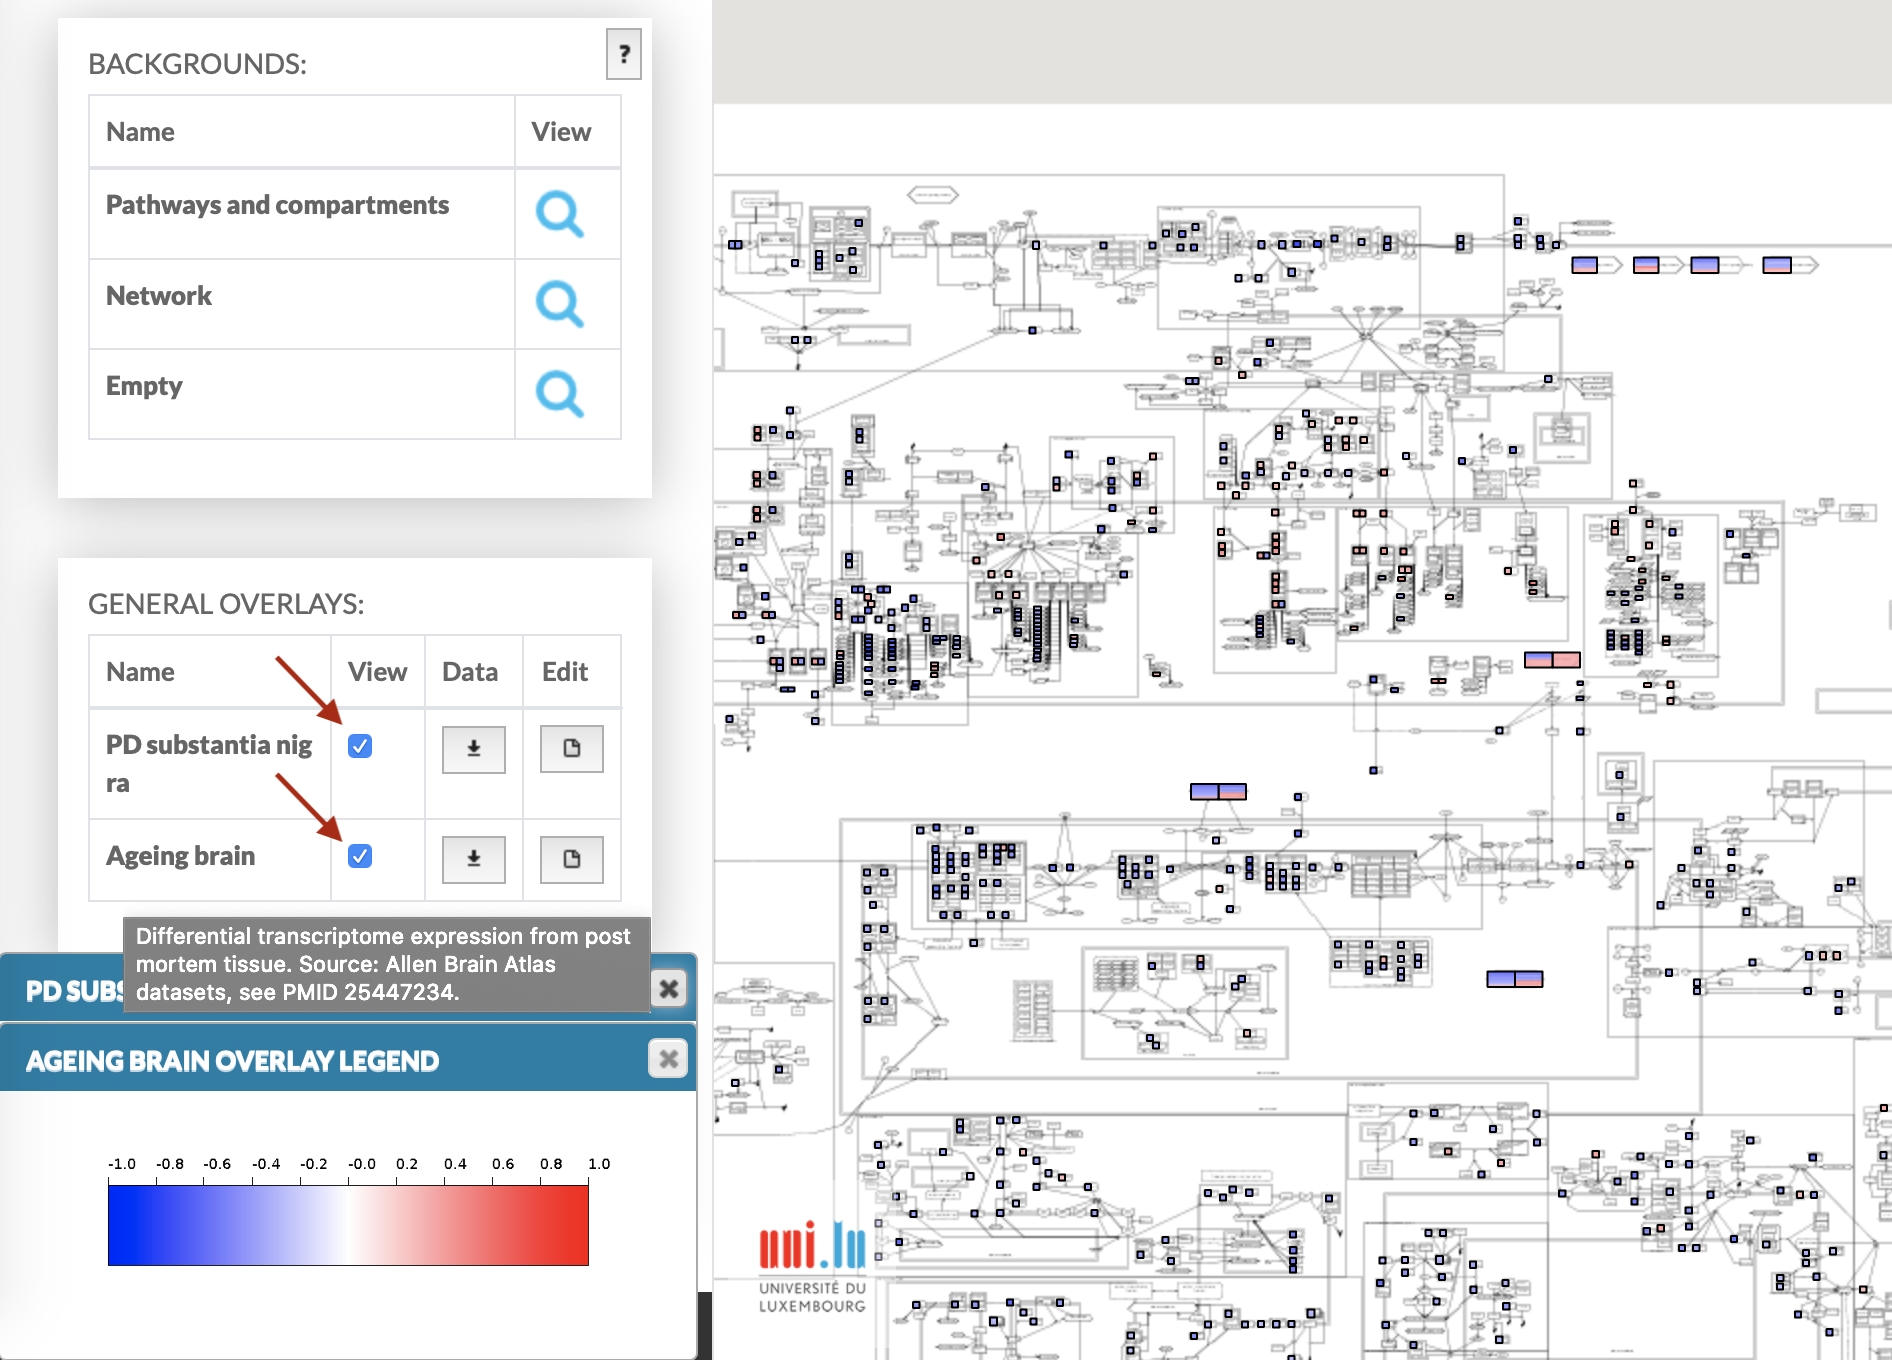
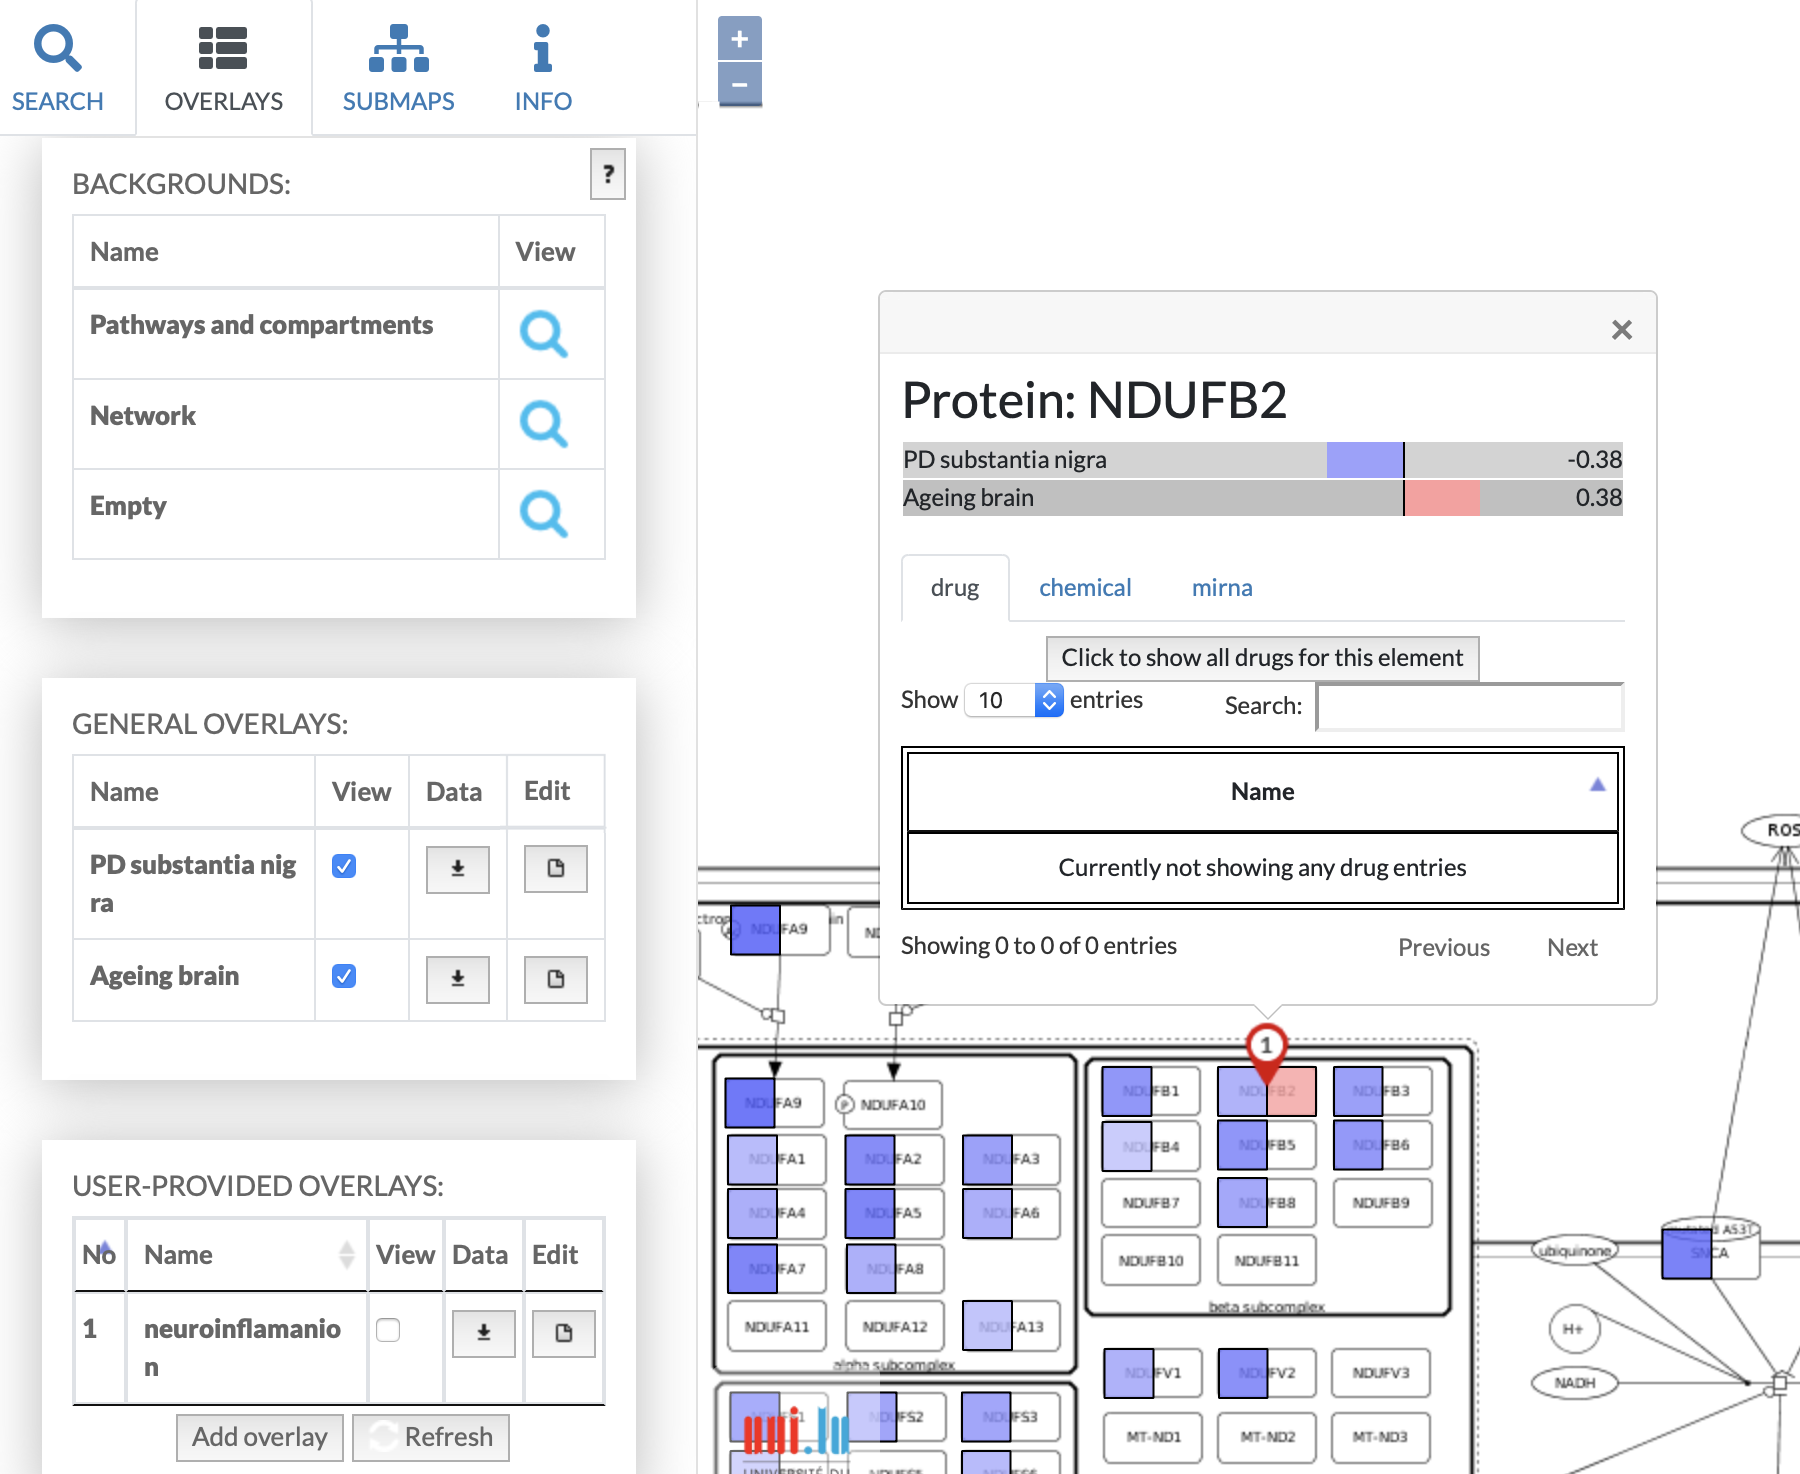
Overlays are also visible in the popup window, displayed after clicking on the element’s pin, showing the value and the sign marked on the horizontal color bars. The popup contains information about Interacting drugs, chemicals and MicroRNA with selected element, available after ticking check box Click to show all drugs for this element.
Upload of user-provided overlay data#
User-provided overlays are the overlays uploaded by and visible to the currently logged user. Available overlays can be reordered by name or number.
Adding a new overlay is available via Add overlay button, which opens the dialog window (image below, marked red).
Note: Refresh button (image below, marked yellow) allows to refresh the overlays list. It is necessary in case an overlay is added via API during viewing a map in a browser.
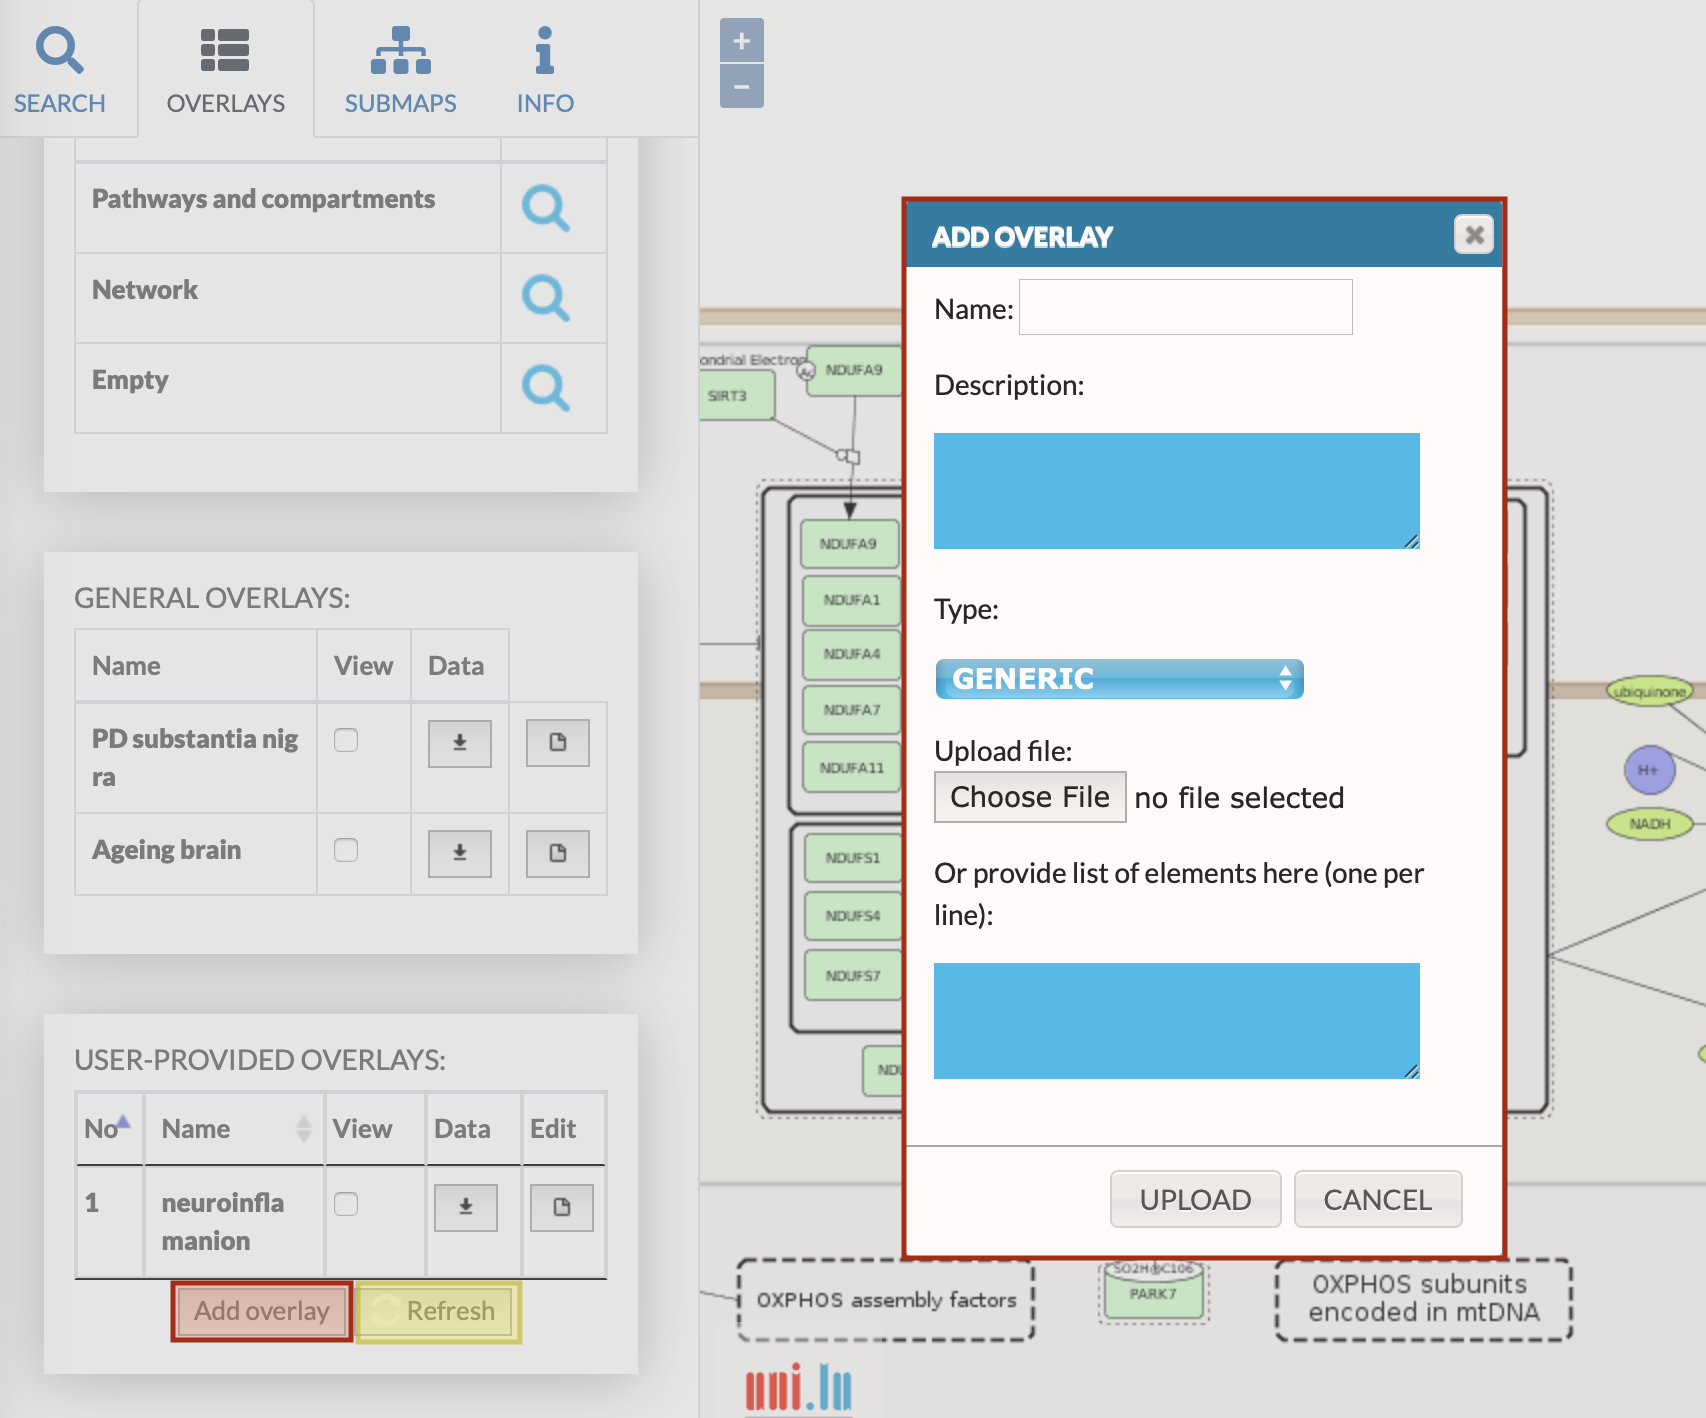
Add overlay button invoking the dialog window with the following components (image above).
Name field for the new overlay.
Description of the dataset.
Type field, which depends on the header of uploaded file - TYPE field. (Data overlay file syntax is explained fully further in the paragraph.) After choosing a file, the dropdown list TYPE switches automatically between GENERIC / GENETIC_VARIANT as MINERVA recognizes file’s header. This happens because genetic variant overlays need to have a specific header field.
- GENERIC overlay displays a coloring on the map according to data set of indicated molecules (e.g. differentially expressed genes).
- GENETIC VARIANT overlay displays a coloring for the genes, for which the variants are present. It also enables the genome browser popup, displaying the position of a variant in the sequence of the corresponding gene. To upload and correctly display the genomics information your instance must contain reference genomes, uploaded by the administrator. Also, the Organism id (e.g. 9606) must be provided for the project, and reference genomes uploaded on MINERVA instance must include its type.
Upload file - Choose file button to select a file with overlay data.
List of elements field - instead of providing an overlay file, the user can provide a list of named elements to highlight in the map (e.g. list of genes). Choose TYPE corresponding to the content of your list: GENERIC for named elements; GENETIC_VARIANT for the variants.
Upload button to generate the user-define.
(Optional) if a map is displayed using Google Maps API engine, Google Maps API Terms of Use checkbox will appear.
Fill the above fields and click UPLOAD button. Your overlay will become available in the left panel.
Important reminder:
The number of available overlays is common for all projects hosted on your MINERVA instance. If a user is registered in a number of projects and uploads custom datasets in all of them, the global number of available custom overlays will be reduced with each uploaded overlay.
Note: The genetic variant overlays additionally contain the genome browser in the popup window (see below):
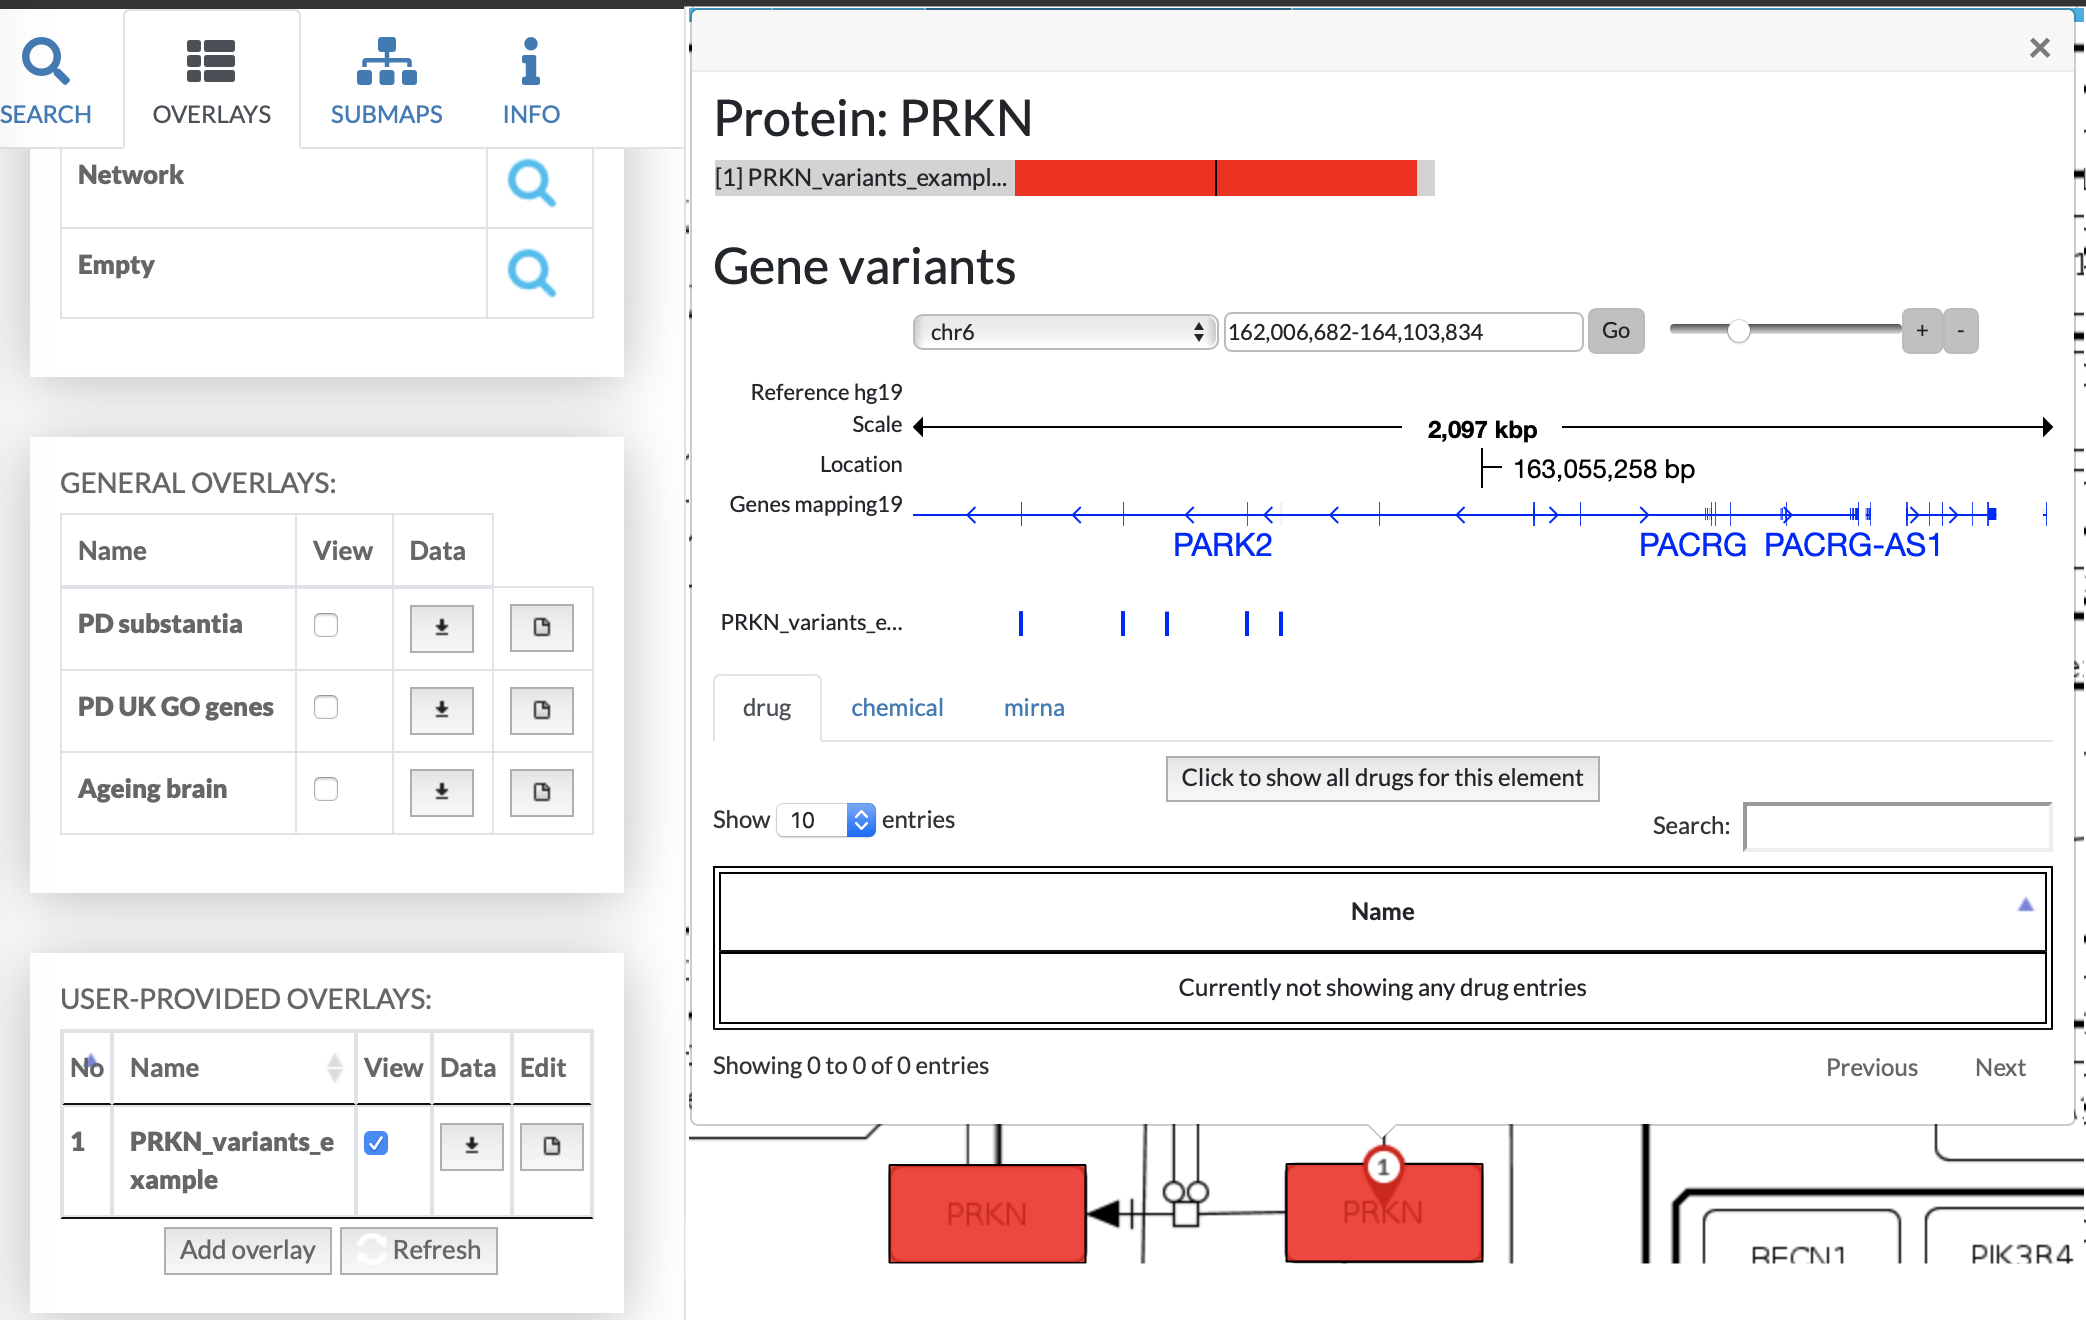
The genome browser allows to view the position of a variant in the sequence of the corresponding gene. Image below presents just the gene browser:
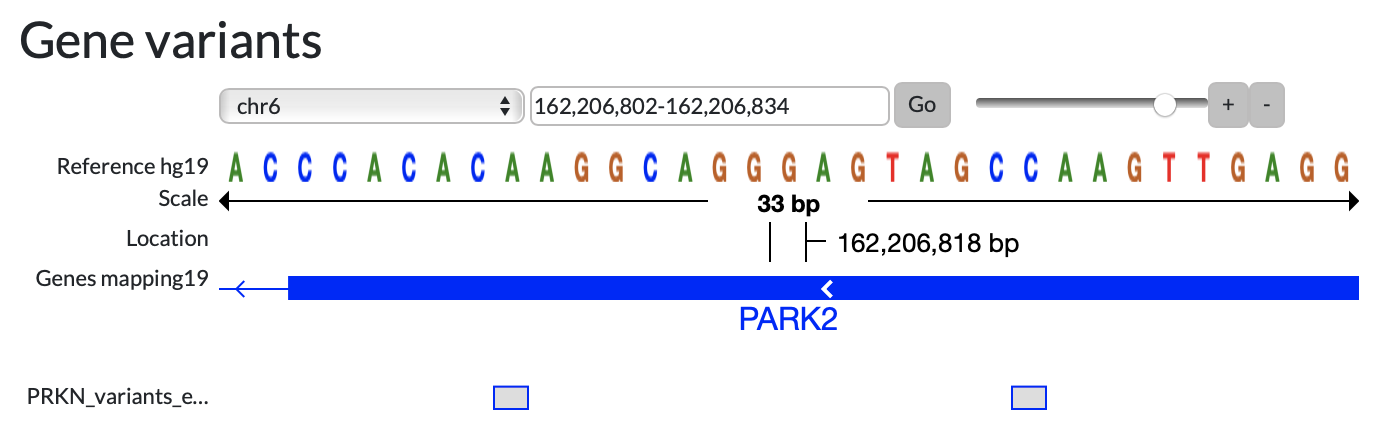
Reference genome contains reference genomes uploaded into the instance by admin (e.g. hg19).
Scale of base pairs display, changed by
 slide.
Location indicates currently viewed position in the genome.
Genes mapping display the reference genes locus provided to the instance by admin, see more in add new genomes.
User-provided overlay displays the variants from uploaded file.
Data overlay files must have correct syntax, so MINERVA could color the map as needed. To learn more about uploading data sets check out the example 3 - custom data upload.
Basic GENERIC format#
Download here the example of basic generic overlay and read its description below.
The file in a basic format is a two-column, tab-separated text file, with the columns Name and Value. Please note that the basic format does not have a header.
Name column contains the names of elements to be colored.
Value column contains the values normalized to [-1, 1] range.
Basic format will match names of the elements provided in the Name column among the names of elements in a given network and for the matching ones will assign them colors: blue for negative values, red for positive values, with the saturation proportional to the value. The color range for the data upload is customizable in the admin panel.
Advanced GENERIC format#
Download here the example of advanced generic overlay and read its description below.
The advanced format allows for by identifier matching, custom color assignment and coloring of interactions. The uploaded dataset has two sections - the header and the body.
The header lines start with
#and contain the following elements:Version -
# VERSION=1.0- a version of this overlay file.Name -
# NAME=my-overlay- a name that will be automatically assigned upon upload.Description -
# DESCRIPTION=The details of my-overlay- a description that will be automatically assigned upon upload.
The body is a table with a set of allowed columns. See the list of all available columns here.
The dataset for upload may be integrated and sparse, i.e. a document may contain all columns at once, and, where irrelevant, their content may be left blank. In other words, you can color interactions and elements in the same dataset, leaving blank fields in element_identifier and line_width for elements, and leaving blank fields in name for interactions.
All data columns work as an intersection to narrow down the coloring. Example: if your map contains only protein SNCA, and you put RNA SNCA, there will be no coloring even though the SNCA is displayed in the map.
GENETIC VARIANT format#
Download here the example of genetic overlay and read its description below.
It is a particular type of advanced format, it contains the header and the body, see below:
- The header lines start with ‘#’ and can contain the following elements:
Type -
#TYPE=GENETIC_VARIANTGenome type -
#GENOME_TYPE=UCSC- type of reference genome being used (e.g. UCSC)Genome version -
#GENOME_VERSION=xyz- version of reference genome being used (e.g. hg19)
- The body is a table with a set of allowed columns. Click here to see the list of all available columns.