Example 3 - Custom data upload by registered users#
You will find here examples of data upload by registered users, for basic and advanced (generic and genetic) overlays.
Basic format#
The file in basic format has two tab-separated columns Name and Value (see also Upload user-provided overlay data):
Name - names of elements to be colored.
Value - a value from [-1, 1] range, to be transformed to red-blue coloring, with negative values colored red, positive colored blue; the saturation of the color will be defined by the absolute value.
Note: blue (for negative values) and red (for positive values) are configured in the admin panel (Overlays) and can differ between MINERVA instances.
Click here to download the basic overlay, containing a custom coloring for the example map.
To upload this dataset, do the following:
Make sure you have the privileges to generate overlays in the example map.
Go to Projects tab and Edit the example map.
In the Users tab, check the box in the View project column.
Open the example map from the Projects tab by clicking on its name (map_example by default).
Make sure that you are logged in by checking the Info tab in the left panel.
In Overlays > User-provided overlays section, choose Add overlay then press Choose File to select basic overlay file to upload.
In Overlays > User-provided overlays tab, click View checkbox to examine generated view.
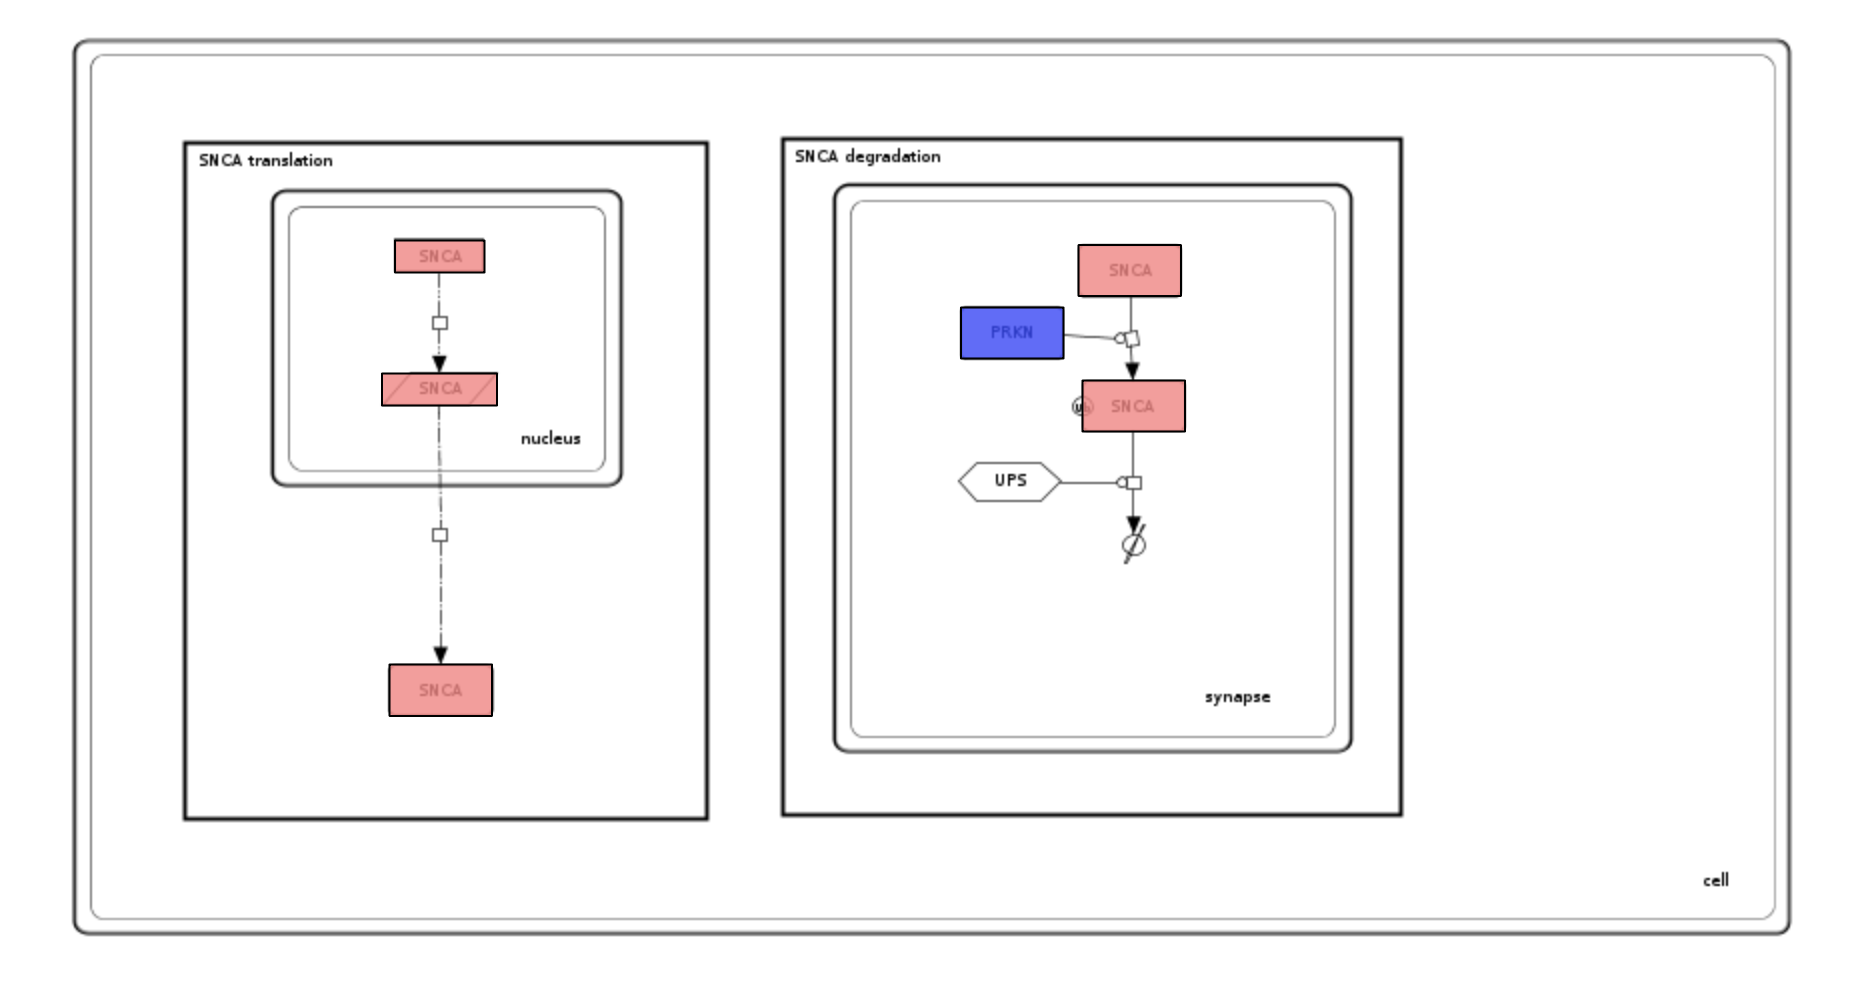
Examine the generated coloring and the uploaded dataset. Please see image below and note that:
All SNCA elements are colored to the same color because of by-name matching.
SNCA elements are red-colored (the value in the file is -0.5).
PRKN is blue (the value in the file is 0.75)
Advanced format - generic type#
Advanced format foresees two parts of the uploaded dataset - header and body (see also Upload user-provided overlay data).
The header lines start with #. It contains the following elements:
#VERSION=xyz- a version of this custom layout#NAME=xyz- a name that will be automatically assigned upon upload#DESCRIPTION=xyz- a description that will be automatically assigned upon upload
The body is a table with the following set of columns.
Warning! Coloring of the elements in different compartments works ONLY for separate (not nested) compartments. Setting a color for elements in a compartment that encloses other compartments does not set the color inside the nested compartments.
By-identifier coloring#
Click here to download the advanced overlay (generic), containing a custom coloring for the example map.
Upload this dataset as in basic format upload.
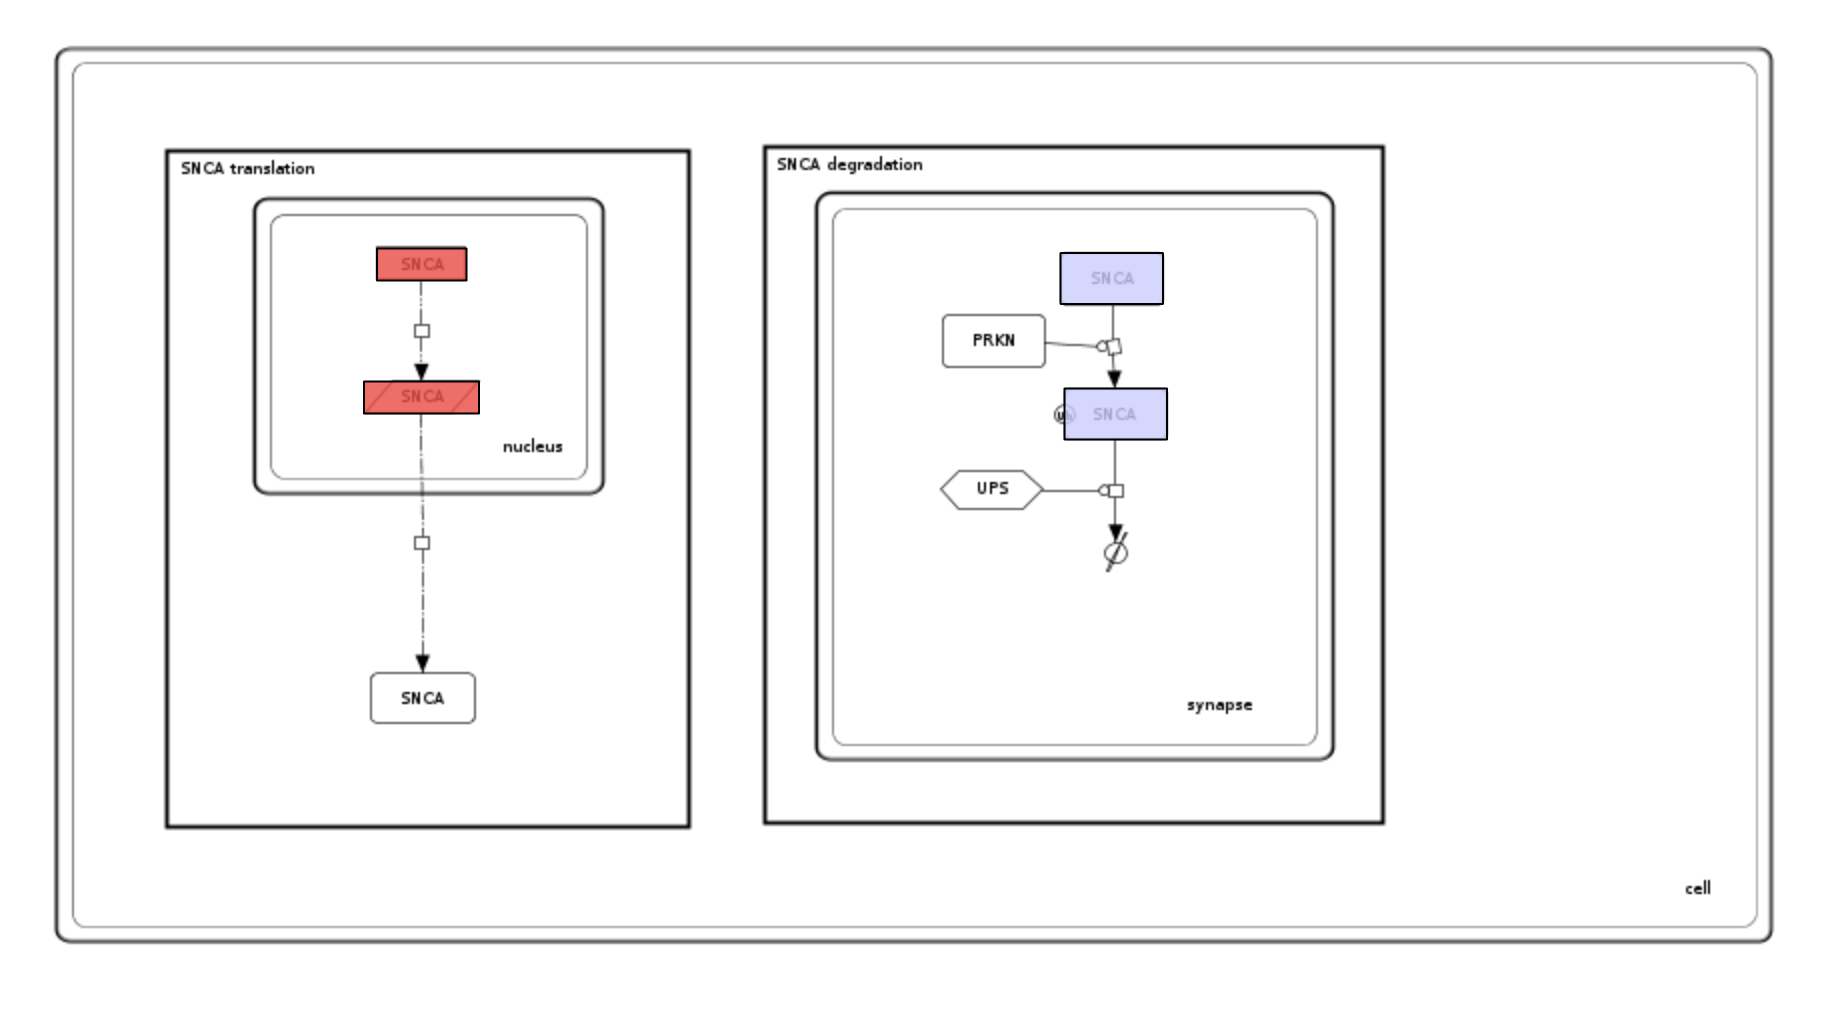
Examine the generated coloring and the uploaded dataset. Please see image below and note that:
elements are colored by their identifiers instead of their names,
SNCA elements in the nucleus elements are colored red, synapse elements are colored blue due to by-compartment coloring.
Phenotype UPS is not colored as the smallest compartment UPS is contained in is synapse, not cell. Warning! Coloring compartments works ONLY for separate (not nested) compartments. For example: setting the color for SNCA identifier in the cell compartment will NOT color the contents of the nucleus and synapse.
Using SNCA coloring by-name overrides by-identifier coloring, the order of selection is as follows:
- match by-name
- match by-identifier
- constrain by-compartment
Custom colors and interaction coloring#
User-defined colors can be assigned to both elements and interactions, using the hex code (e.g. #fffaaa).
Click here to download the interactions overlay, containing a custom coloring for the example map.
Upload this dataset as described above in basic format upload.
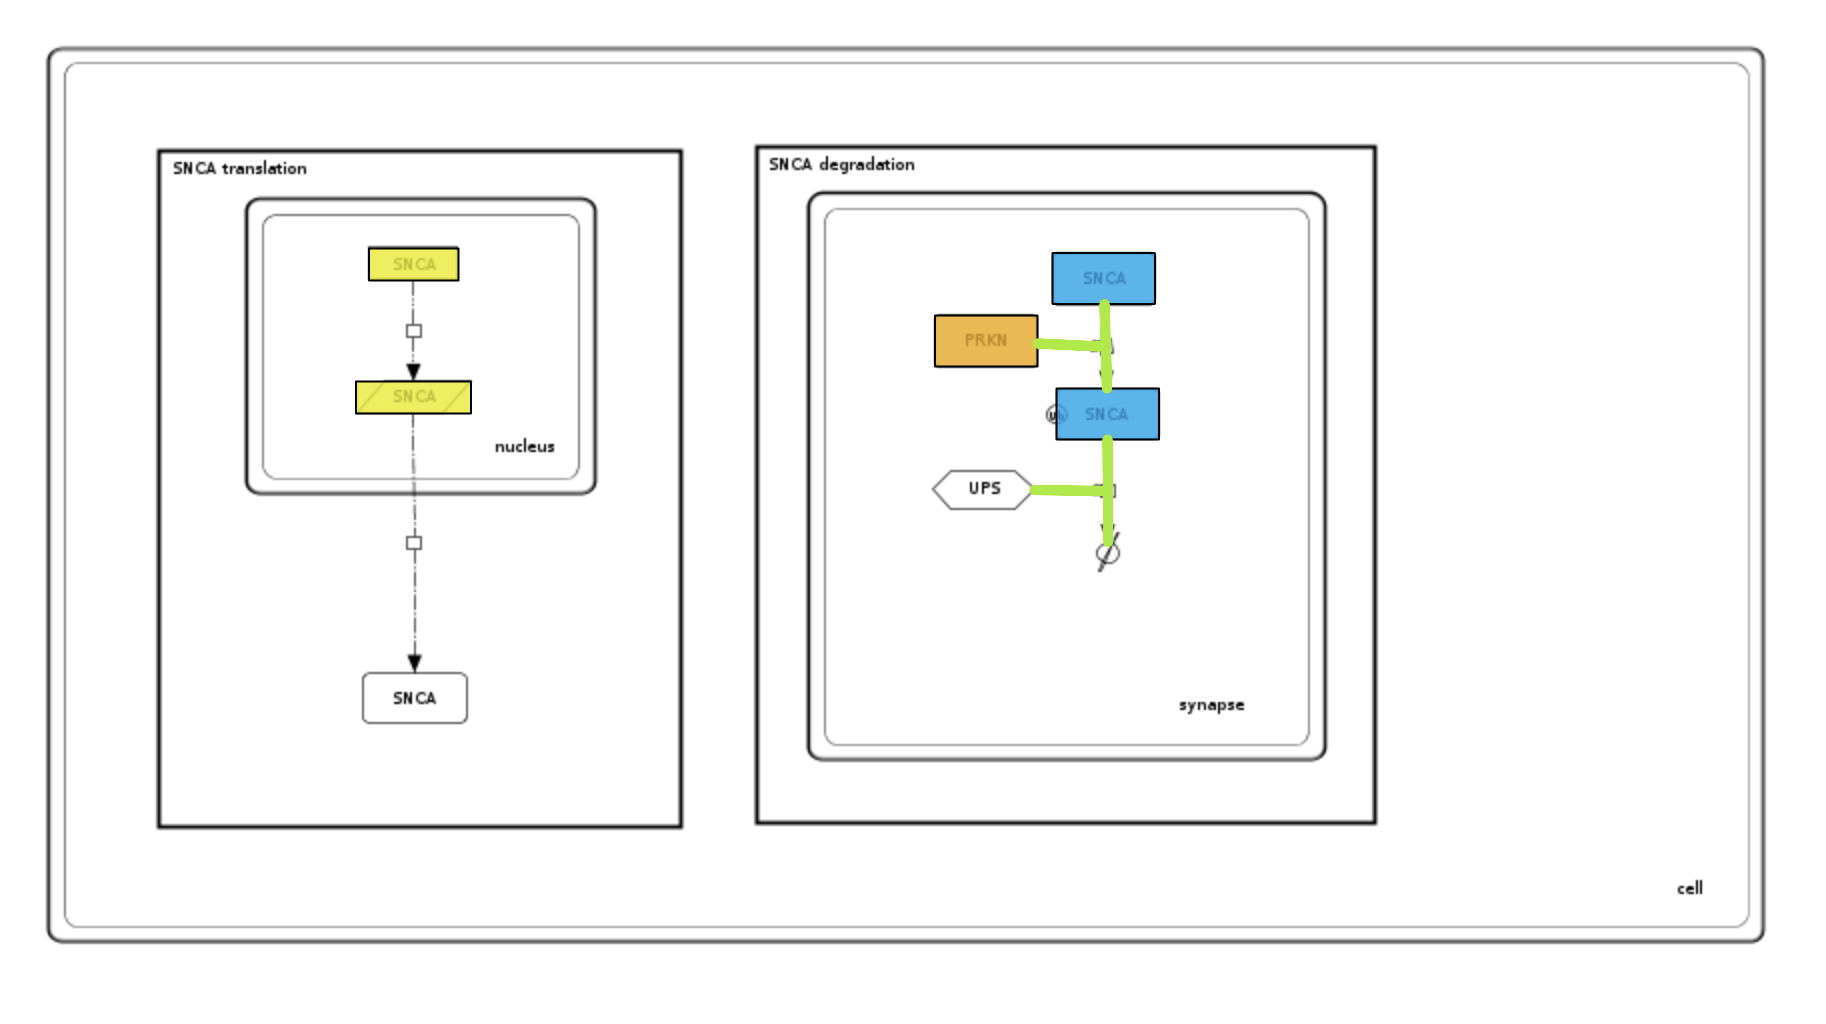
Examine the generated coloring and the uploaded dataset. Please see image below and note that:
color column replaces value for defining colors of interactions and elements; both parameters cannot be used simultaneously.
reaction id provided in element_identifier it is not constraint by compartment (as more than one compartment can contain reactions line).
Remarks#
The uploaded dataset must be a text file.
Column Name refers to the full name in the annotation panel; e.g., HGNC gene name for genes/proteins; ChEBI name for simple molecules or GO name for a Gene Ontology term.
Identifiers of the elements in the dataset have to follow the MIRIAM standard; e.g., HGNC: 11138; Ensembl: ENSG00000184845; ChEBI: CHEBI:18243.
Most columns can be used simultaneously. If the same element is addressed in two different columns, it will be colored with these two colors.
Restrictions:
Either a value or a color columns is necessary in the uploaded dataset, but they mutually exclusive.
Reactions to be colored should be identified only by reaction id or PubMed.
If the compartment column is used, it is highly recommended to fill all its fields with a compartments name from the map. Element which does not have defined compartment will be colored in the whole map.
Alternatively: you can always export an area of interest as a CellDesigner file, open it in CellDesigner and color it there.
Advanced format - genetic variant#
Genetic variant is an advanced overlay in a specific format. Click here to download the genetic variant overlay, for the example map.
Before upload, check if Organism type is defined for your project (see section Edit project). If it is missing, the genome browser will not be displayed. Upload the overlay as in basic format upload. Please note that field TYPE automatically switch onto GENETIC VARIANT after choosing the file, because of the header. Click View to display coloring on the map (see below).
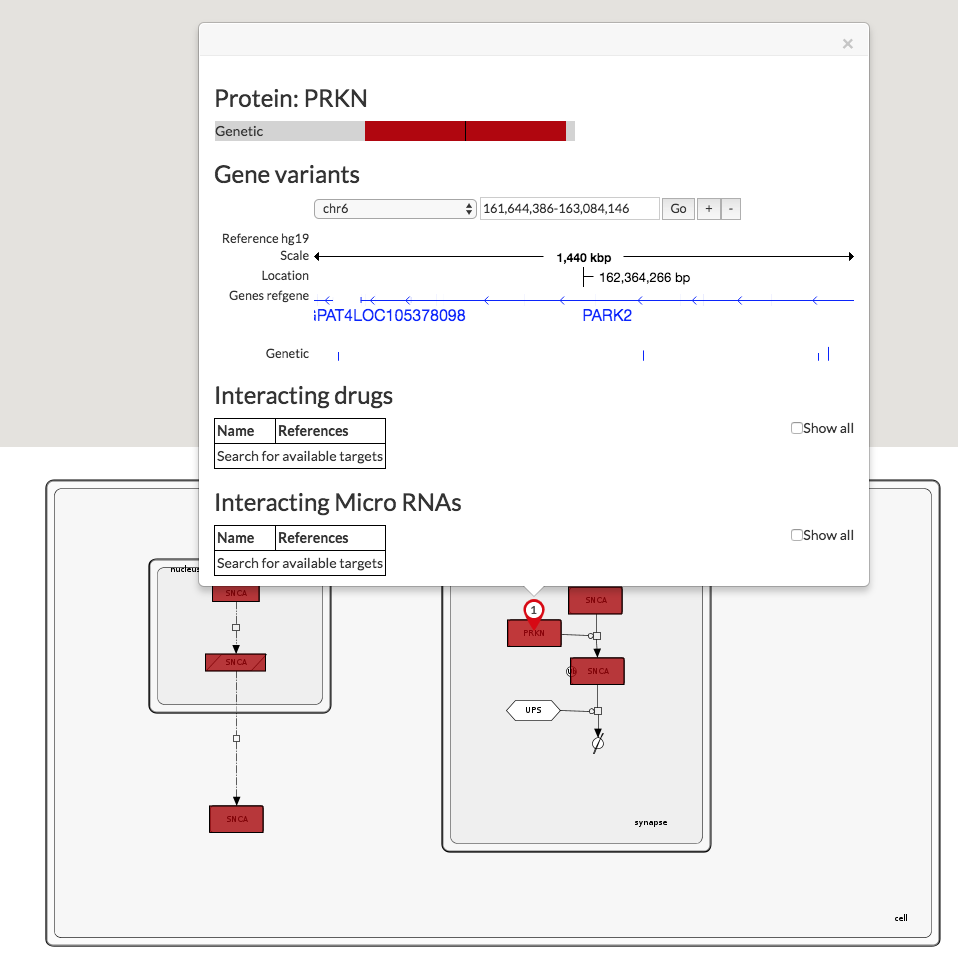
In the map, SNCA and PRKN are colored, indicating that the overlay contains genetic variants for these elements. Clicking on the pin display popup window with the genome browser. To take a closer look at the sequence, you can zoom in/out using button +/-. In the bottom row, in our example named Genetic, we see the locus of the particular variant. There are four PRKN variants in the example. The height of the mark | corresponds to the allele frequency.